Fig. 2.
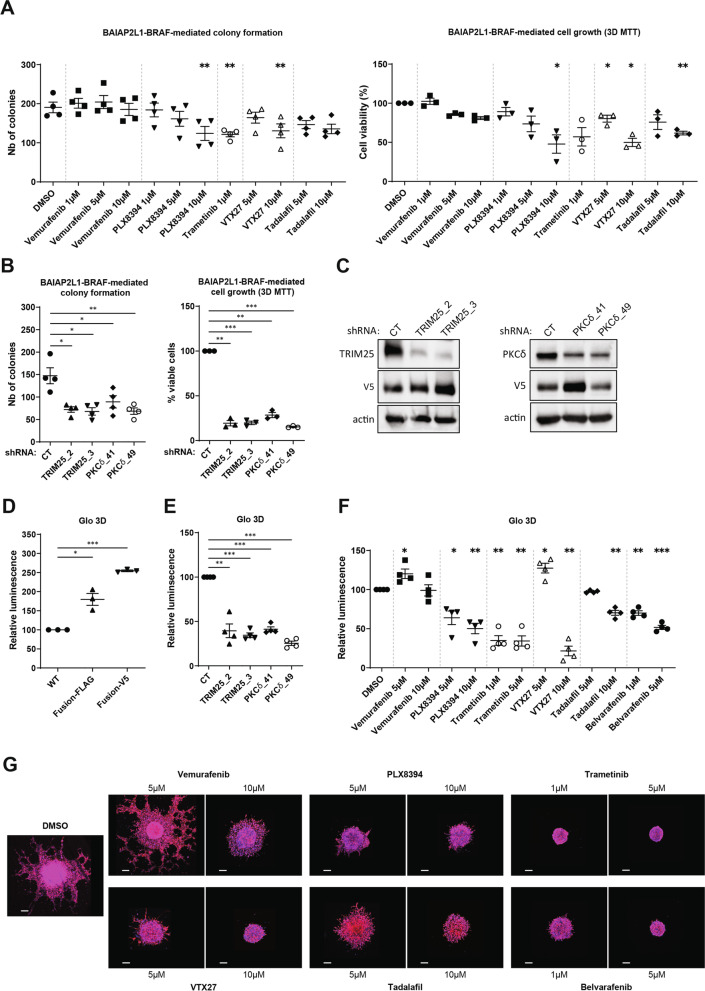
Inhibition of BRAF or factors deregulated in tumors blocks BAIAP2L1-BRAF-mediated cell transformation. A Colonies counts (left, n = 4) and 3D MTT (right, n = 3) of cells stably expressing BAIAP2L1-BRAF-FLAG WT and analysed 5 days after indicated treatments (error bars = SEM, paired t test, two-tailed, P value: * < 0.05, ** < 0.01). B Colonies counts (left, n = 4) and 3D MTT (right, n = 3) of cells stably expressing BAIAP2L1-BRAF-V5 WT and the indicated shRNAs, analysed 5 days after seeding (error bars = SEM, paired t test, two-tailed, P value: * < 0.05, ** < 0.01, *** < 0.0001). C Western blot detection of extracts from Nthy-ori 3–1 cells stably expressing BAIAP2L1-BRAF-V5 WT and the indicated shRNAs. D Nthy-ori 3–1 cells stably expressing EV, BAIAP2L1-BRAF-FLAG or BAIAP2L1-BRAF-V5 and E Nthy-ori 3–1 cells stably expressing BAIAP2L1-BRAF-V5 along with indicated shRNAs were cultured as 3D spheroids for 3 days in the presence of 6 μg/mL collagen. Presence of metabolically active cells was measured with 3D viability Glo Assay (error bars = SEM, n = 3 or 4, paired t test, two-tailed, P value: * < 0.05, ** < 0.01, *** < 0.0001). F Nthy-ori 3–1 cells stably expressing BAIAP2L1-BRAF-FLAG were cultured as 3D spheroids for 3 days, treated with indicated compounds and incubated for 3 more days. Cell viability was assessed with 3D viability Glo Assay (error bars = SEM, n = 4, paired t test, two-tailed, P value: * < 0.05, ** < 0.01, ns-not significant). G Representative fluorescence microscopy images of Hoechst (blue)/phalloidin (red) staining of spheroids from cells stably expressing BAIAP2L1-BRAF-FLAG WT embedded in Matrigel for 3 days and treated with indicated compounds. Scale bar: 200 μm

