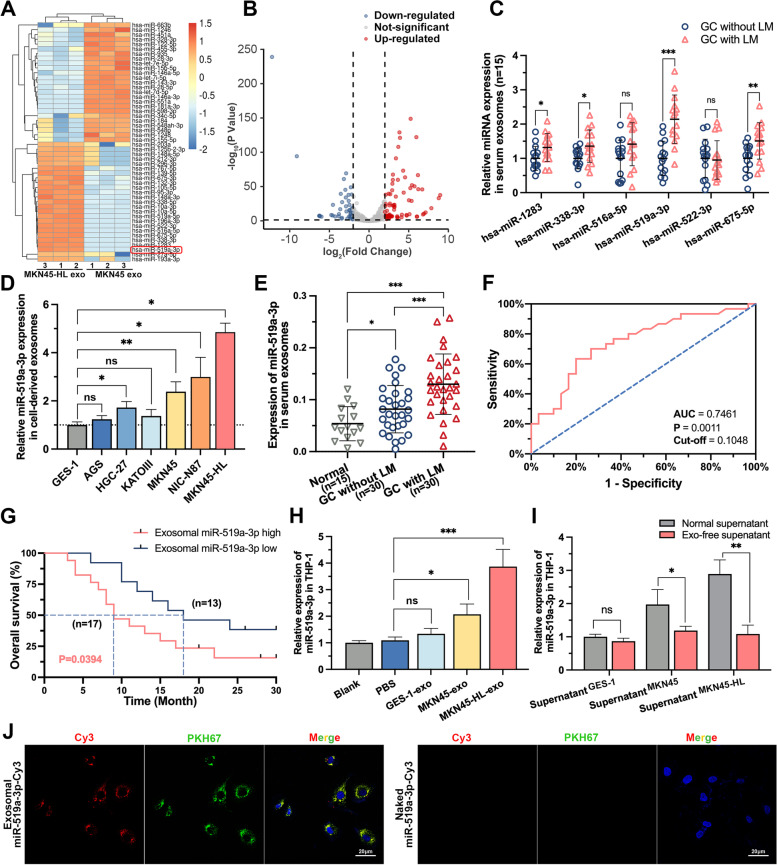
Fig. 4.
miR-519a-3p is highly expressed in exosomes from GC cells with high hepatic metastatic potential and can be transferred to macrophages via exosomes. A. Heatmaps of exosomal miRNAs show significant differences in the supernatant of MKN45-HL cells as compared to that of MKN45 cells (n = 3). B. Volcano plot of exo-miRNA-seq showed miRNAs with significant up- and down-regulation of expression. C. The top 6 upregulated miRNAs in exo-miRNA-seq were further validated by qRT-PCR in serum exosomes from GC patients with or without LM. D. The expression levels of miR-519a-3p in exosomes derived from six different GC cell lines and one normal gastric mucosal epithelial cell line were measured by qRT-PCR. E. Expression of exo-miR-519a-3p was detected by qRT-PCR in 30 GC patients with/without LM and 15 healthy volunteers. F. ROC Curve was generated based on exo-miR-519a-3p expression in serum from 30 GC-LM patients. G. KM plot was generated based on exo-miR-519a-3p expression in serum from 30 GC-LM patients. The cut-off value was determined based on the results of the ROC curve. H. PMA-treated THP-1 cells were incubated with PBS or GC cells (MKN45 and MKN45-HL)-derived exosomes for 48 h, and then miR-519a-3p expression was detected in THP-1 cells by qRT-PCR. I. PMA-treated THP-1 cells were cultured for 48 h with normal supernatants of GES -1, MKN45, and MKN45-HL cells and exosome-free supernatants (removed by ultracentrifugation). Subsequently, the expression of miR-519a-3p in THP-1 cells was detected by qRT-PCR. J. The left panels show the presence of Cy3 fluorescence and PKH67 lipid dye in PMA-treated THP-1 cells after addition of PKH67-labelled exosomes derived from MKN45 cells for 12 h. PMA-treated THP-1 cells incubated with naked-miR-519a-3p-Cy3 served as negative controls (the right panels). Scale bar = 20 μm. Data are shown as mean ± standard deviation of 3 independent experiments, and statistical significance was determined using Student’s t test, one-way ANOVA test, and log-rank analysis (*P < 0.05, **P < 0.01, ***P < 0.001)

