

Abstract
Purpose:
Cannabis use is increasing among emerging adults (ages 18–25), necessitating the need for prevention interventions. Using a novel platform – social media – we developed an 8-week motivational interviewing and cognitive-behavioral intervention targeting cannabis use among emerging adults. Herein, we report on the feasibility and acceptability of the intervention in a pilot trial.
Procedures:
For NCT 04187989 we recruited N = 149 emerging adults who used cannabis (at least 3 times/week for the past month) using social media advertising. Their mean age was 21.0 years (SD = 2.2); 55.7% were female. Most were White (70.5%; 20.1% Black/African American, 9.4% Other races), with 20.1% identifying as Hispanic/Latinx. Participants were randomized to the 8-week intervention or an 8-week attention-placebo control condition, both delivered in secret Facebook groups by electronic health coaches (e-coaches). Follow-up assessments occurred at 3- and 6-months.
Results:
The intervention was well-received and follow-up rates were high; fidelity was good. Intervention participants rated e-coaches significantly higher in terms of helpfulness, warmth, etc., compared to control participants. Intervention participants were more likely to engage with and recommend the group. In terms of percentage reductions in cannabis outcomes, the intervention group evidenced absolute reductions over time in several measures of cannabis consumption across modalities. In an adjusted model, reductions in vaping days in the intervention group, relative to attention-control, reached statistical significance (p=.020, D = .40).
Conclusions:
This social media intervention for emerging adults’ cannabis use was feasible and acceptable in the target population warranting future testing in a fully powered trial.
Keywords: emerging adults, cannabis, social media, motivational interviewing
1. Introduction
Cannabis use is increasing among emerging adults (EAs; ~18–25 years-old), the age group with the highest prevalence in the United States (Substance Abuse and Mental Health Service Administration, 2021). Cannabis prevalence peaks at ages 21–22 and past-year use rates are similar regardless of college enrollment status (Schulenberg et al., 2020). Current cannabis products have higher potency than ever before (ElSohly et al., 2021; ElSohly et al., 2016; Freeman et al., 2021), including extracts with ≥70% THC (Hall and Lynskey, 2020; Jones et al., 2016; Matheson and Le Foll, 2020) and flower at 20–45% THC (Cash et al., 2020; Mahamad et al., 2020; Smart et al., 2017). Increases in EAs’ vaping (13% 30-day prevalence) from 2017–2019 are particularly alarming (Schulenberg et al., 2020).
Prevalence is increasing in a context of more permissive laws (e.g., over a dozen states allow legal recreational cannabis; most allow medical cannabis), increased access (i.e., ~90% of EAs say cannabis is easy to get), and historical lows in cannabis disapproval and risk perceptions (Azofeifa et al., 2016; Carliner et al., 2017; Salas-Wright et al., 2016; Somerville, 2016). Early cannabis use increases risk for short- and long-term negative physical, psychiatric, and social outcomes, and cannabis use disorder (CUD) (Behrendt et al., 2009; Castellanos-Ryan et al., 2016; Hall and Degenhardt, 2009; Scott et al., 2018; Sun et al., 2020; Volkow et al., 2014). Preventive interventions to address cannabis use among EAs are necessary, as few seek treatment (Arterberry et al., 2020; Standeven et al., 2020).
Emerging adulthood is a unique developmental period involving role transitions and independence that can facilitate risky cannabis use (Arnett, 2000, 2005). This period is distinct from younger adolescence and full adulthood, necessitating developmentally-tailored interventions. A recent review (O’Connor et al., 2020) of drug use prevention found only 2 interventions focused on EAs: 1) a trial with 19 year-old males in Switzerland (Gmel et al., 2013) involving a brief intervention and booster randomization, and 2) another trial with American college students (Lee et al., 2010) using personalized feedback. Both studies found no significant intervention effects on cannabis use.
In contrast, a recent meta-analysis of brief interventions (~1–2 sessions, in-person; ages 15–30 inclusion criteria) supported small reductions in CUD symptoms and increases in abstinence at short-term follow-ups (1–3 months) compared to control conditions (Halladay et al., 2019). The meta-analysis, which largely included non-treatment seekers, found that consumption, consequences, and long-term outcomes (6–12 months) were no different when pooling across intervention studies versus passive control conditions. Another meta-analysis across adult ages suggested no pooled impact of healthcare-based brief interventions on cannabis use severity scores and days of cannabis use, with recommendations including: extended interventions, addressing peer networks, and consideration of how the acceptability of cannabis use and legal status could affect efficacy (Imtiaz et al., 2020). Importantly, most studies occurred prior to shifts in cannabis availability and proliferation of newer consumption modalities and higher THC products.
In summary, current gaps pertaining to cannabis interventions for EAs could be addressed by new approaches. First, interventions likely need to be longer than 1–2 sessions, and could be enhanced by modalities that allow for intervening during daily life when cannabis consumption occurs (as opposed to during a healthcare visit, school-based interaction, or one-time web program). Such lengthening and ongoing engagement could result in stronger effects on cannabis-related behaviors when also rooted in evidence-based approaches from substance use trials (e.g., Motivational Interviewing [MI], cognitive-behavioral approaches; (Bernstein et al., 2009; Magill et al., 2009; Walker et al., 2016; Woolard et al., 2013; Yurasek et al., 2015). Given increased cannabis acceptability, intervention content must consider harm reduction approaches across consumption modalities, with updated psychoeducation about potency and risks. Finally, intervention studies have targeted a range of cannabis inclusion criteria (e.g., monthly use to CUD), and focusing on more frequent consumers (e.g., several times/week or more) may have a wider public health benefit than focusing on individuals who use infrequently.
We developed and piloted a new 8-week MI-based intervention using a novel, constantly accessible platform: social media. EAs are avid users of social media (84%, M=46 hours/month) (Gutierrez and Cooper, 2016). Others have used social media for health behavior interventions (Bonar et al., 2020; Bull et al., 2012; Maier et al., 2020; Pagoto et al., 2016; Ramo et al., 2015; Young et al., 2015), moving the intervention out of the clinician’s office or school and into daily life where behavior change occurs, but none have targeted cannabis. Further, 70% of EAs use Facebook (71% Instagram, which is owned by Facebook and allows cross-posting; 65% Snapchat; 48% TikTok) (Auxier and Anderson, 2021), which provides optimal features for private group-based discussions on threads, consistent with key considerations for social media interventions (Moreno and D’Angelo, 2019). Herein we describe the intervention development and approach, trial feasibility, acceptability and engagement, and preliminary outcomes.
2. Method
2.1. Design
This Stage 1 (Onken et al., 2014) pilot randomized controlled trial (RCT) recruited 18–25 year-olds for online screening, enrolling those using cannabis ≥3 times/week in the past-month (Bonar et al., 2021). This eligibility criterion was selected because prior work (Pearson et al., 2017) showed that EAs who used cannabis 2–3 times per week in the past-month experienced a M = 6 consequences. Participants were randomized to groups (separated by age [18–20; 21–25] and residence in a state with legal recreational cannabis [yes/no]) consisting of an 8-week intervention or attention-control. Follow-ups occurred at 3- and 6-months. Our institutional review board provided approval and a Certificate of Confidentiality was issued.
2.2. Procedures
Because of limited pilot staffing, we conducted recruitment sequentially in two waves: Wave 1 (2/3/20–2/26/20) enrolled participants residing in states without legal recreational cannabis and Wave 2 (5/11/20 – 5/28/20) enrolled those in states with legal recreational cannabis. The ordering of non-recreational states followed by recreational states was chosen to allow more time for recent cannabis recreational laws (e.g., Michigan) to be in place before recruitment since these laws affect access and availability. Recruitment used online targeted advertisements (e.g., age, interested in cannabis-focused media) on Facebook and Instagram using a script (i.e., “Use weed? Participate in a research study; earn $ $ $.”) and images of EAs (varied gender and racial/ethnic appearance). Ads did not request individuals want to reduce cannabis use.
Clicking the ad led to a screening consent followed by an eligibility survey. Those meeting inclusion criteria were redirected to a separate contact information page. Using procedures from prior work (Bauermeister et al., 2012; Teitcher et al., 2015), study staff verified participants and their Facebook profile then participants were selected (based on order of screening completion and racial, ethnic and sex distribution to meet targeted enrollment goals) and sent a link to a baseline/RCT consent form (fully available on ClinicalTrials.gov) and baseline survey ($35 compensation). Baseline consenting included reviewing a “User Safety Agreement” where participants signified agreement to follow group guidelines (e.g., no selling substances; no business advertising; respect and confidentiality). The consent form described the study’s purpose as “to develop and test social media interventions to help young people increase well-being and reduce risky behaviors.” The intervention group was described as a “secret Facebook page that will deliver health information focused on increasing well-being and reducing risky behaviors” where participants could interact. The control group was described as a “secret Facebook page that will share news and other information about things like entertainment, sports, weather and current events.”
Next, participants submitted a timestamped selfie for study staff to compare to their Facebook profile for identity verification. In Wave 1, to support self-report, consented participants were mailed a urine drug screen (UDS) to self-administer from home and instructions for taking photos of results to upload via a survey link at baseline. However, given limited utility of biological verification in non-abstinence focused early interventions combined with COVID-19-related feasibility challenges, the UDS procedure was removed.
After individuals were randomly assigned to a condition, they received a Facebook friend invitation from a study staff member’s work account to join a secret, private group. Groups included a cover photo with crisis text/phone lines for emergencies indicating that groups would not be monitored 24/7; after 56 days, groups were archived (i.e., content viewable, but no new posts or comments allowed). Participants completed follow-up surveys online at 3- and 6-months ($35, $40 gift card compensation, respectively) after group-start.
2.3. Study Conditions
2.3.1. Control Group.
Daily for 56 days, staff posted manual-based content (e.g., articles, memes, links) in the group (~6 posts/day). Content was unrelated to substance use or mental health and followed weekly themes (e.g., travel, sports, animals). Staff responded to participant comments (e.g., brief comment, clicking reaction button), but did not use therapeutic techniques.
2.3.2. Intervention Group.
Daily for 56 days, staff (referred to as “e-coaches”) posted content in the group (~6 posts/day) consistent with weekly themes (Table 1). Posts mentioned cannabis (e.g., influence on mental health), addressed the theme without directly mentioning cannabis (e.g., eliciting coping strategies for mental health), and/or focused on building rapport and participation (e.g., introductions, goals/accomplishments, pet pictures). Content on alcohol and other drugs was included as a secondary focus.
Table 1.
Weekly intervention themes with sample topics for each week
| Week | Overarching topics |
|---|---|
| Week 1 |
Dealing with stress
|
| Week 2 |
What young adults do
|
| Week 3 |
Strategies to stay safe while using
|
| Week 4 |
Dealing with difficult situations
|
| Week 5 |
Relationships with friends and family
|
| Week 6 |
Reducing use/avoiding too much use
|
| Week 7 |
Staying healthy
|
| Week 8 |
Free time activities
|
Note. Although each week had a primary theme, topics could also be mentioned in other weeks (e.g., impaired driving is addressed in multiple weeks) to allow for variety in content over time.
Content addressing cannabis use (i.e., smoking, vaping, dabbing, and edibles), was developed through an iterative participant-stakeholder approach (Figure 1). First, we asked M-Turk workers ages 18–25 to identify engaging online content for intervention topics (e.g., “Sometimes people want to cut back their [marijuana] use but have trouble resisting temptation in a difficult situation. Please attach one meme/picture, video and article highlighting ways to handle these tricky situations.”). After our team selected relevant content (e.g., articles, memes, images/infographics, links, gifs), the PI and study coordinator paired the items with MI-informed evocative questions/introductions to encourage discussion. We recruited 40 EAs (57.5% male sex; 60% White, 20% Black/African American, 12.5% Multi-Racial, 7.5% Other Race; 22.0% Hispanic/Latinx) reflecting RCT eligibility criteria and procedures to rate the content and suggest changes to make it more appealing or relevant, which we reviewed and refined iteratively.
Figure 1.
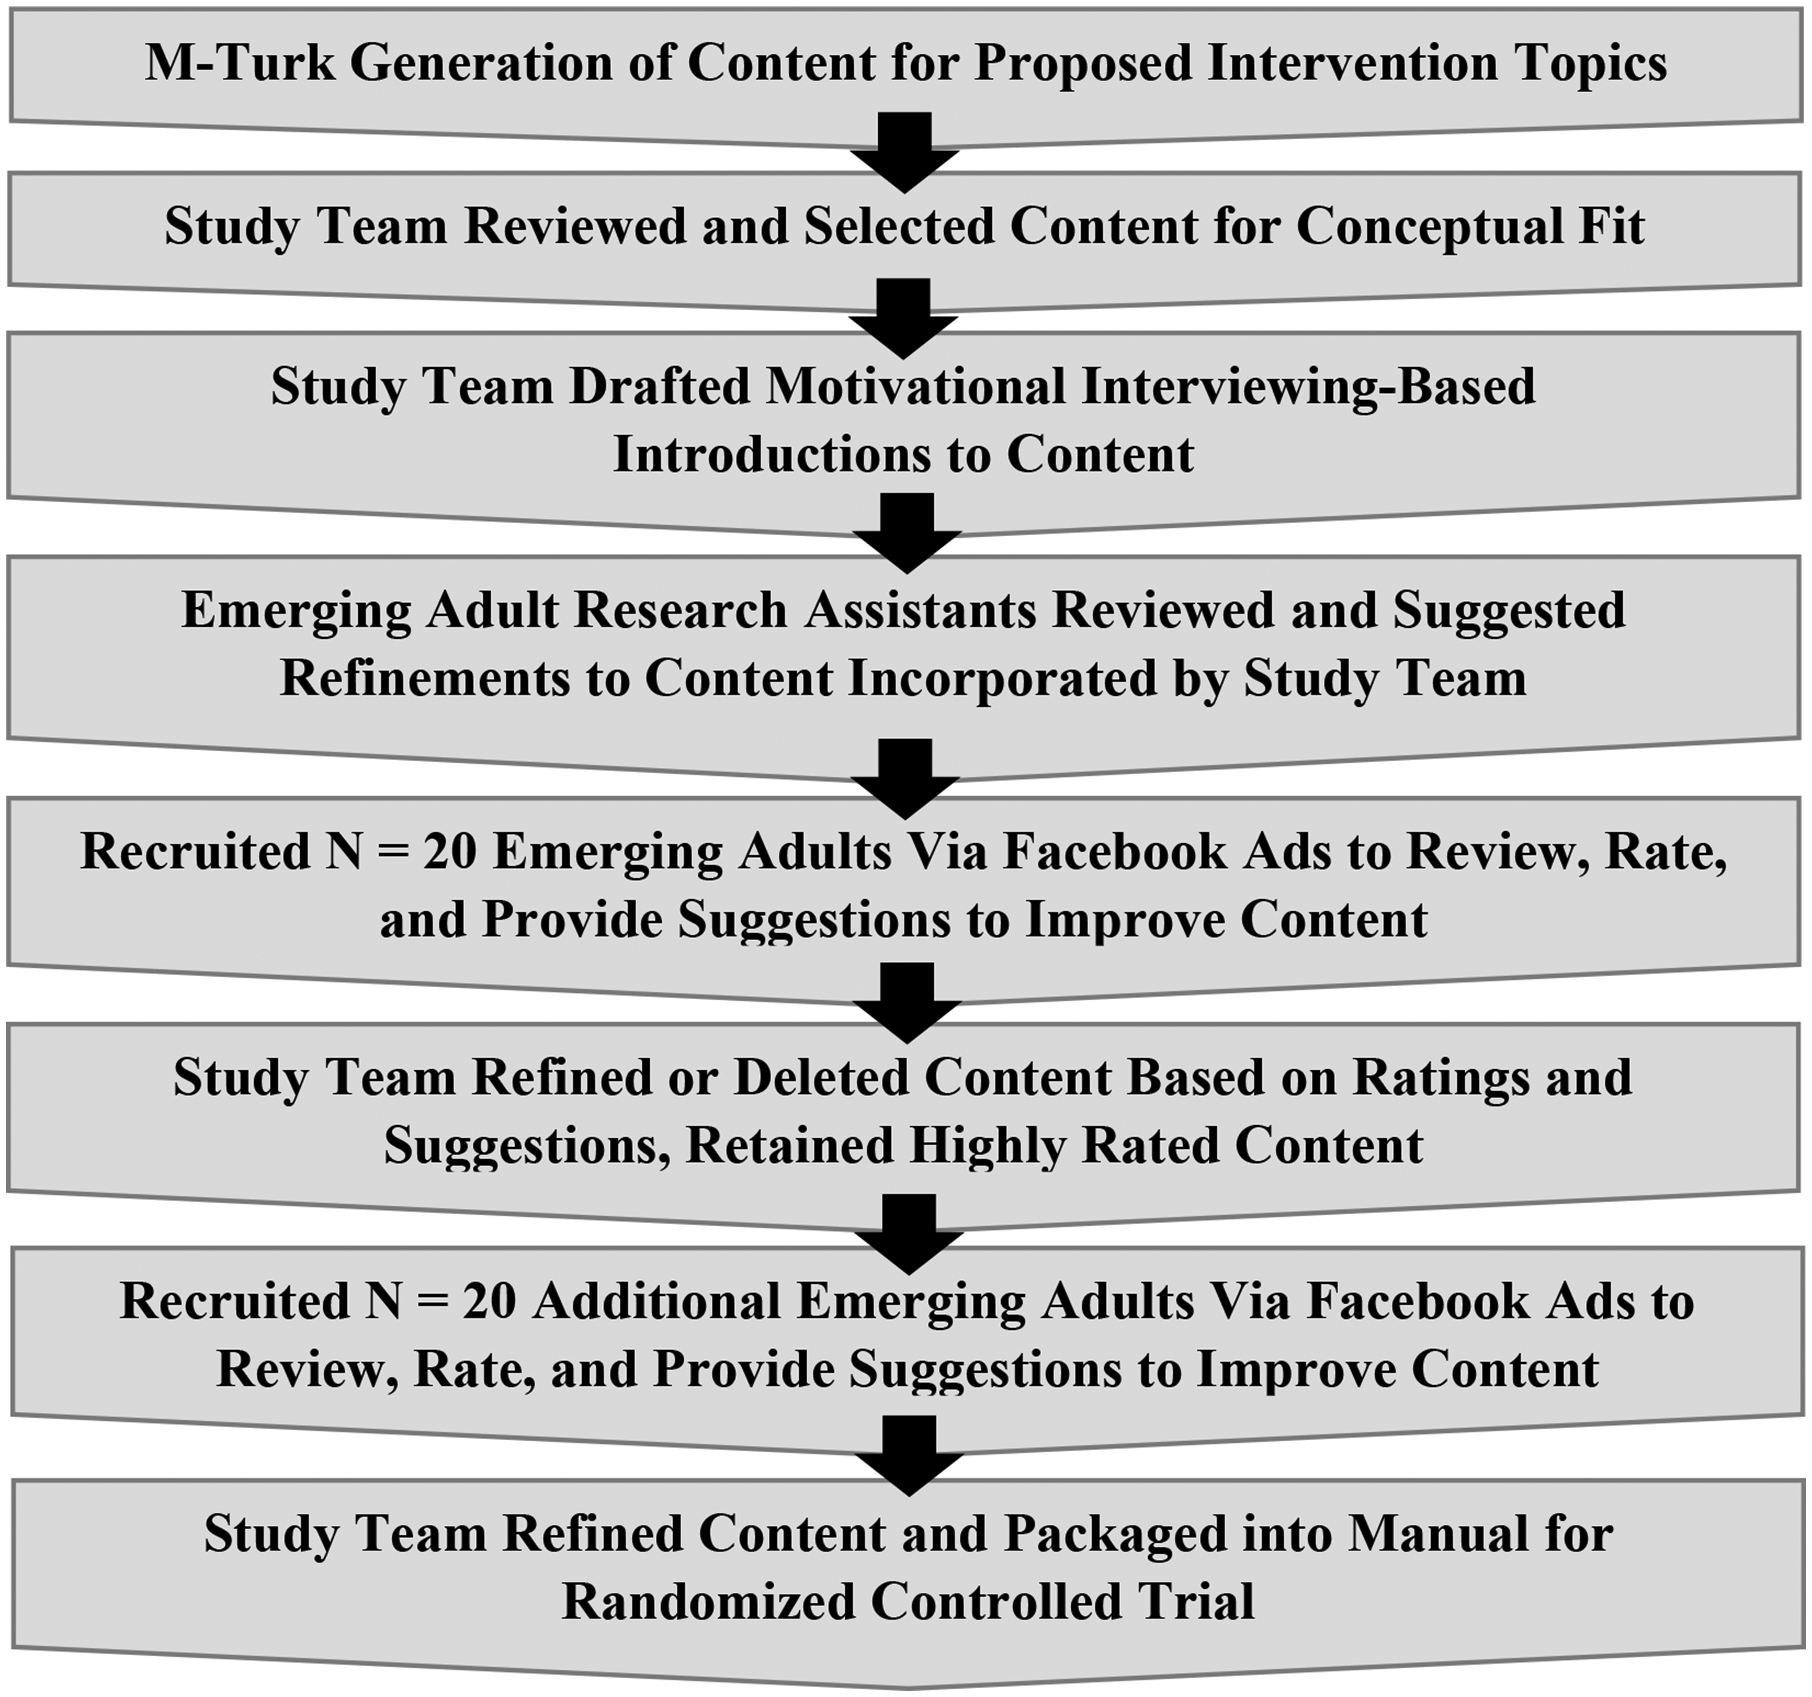
Iterative process used to develop intervention content
The manualized content was reviewed prior to posting, with e-coaches making minor edits to improve relevance (e.g., reflecting participant comments, COVID-19). E-coaches posted in shifts throughout the day and responded to participants to elaborate discussion using MI skills.
2.4. E-coach training, supervision, and fidelity
E-coaches were master’s-level staff with relevant backgrounds (e.g., social work). They completed online MI training modules, attended a two-day MI training from the PI (a member of the Motivational Interviewing Network of Trainers), and study-specific trainings about cannabis, cognitive-behavioral skills for cannabis reduction, social media intervention delivery, and risk management. E-coaches practiced MI-based responses offline to mock participant posts created from public Reddit threads (e.g., cannabis use, mental health, other substance use), with feedback from the PI. Throughout the RCT, to monitor fidelity in near real-time, e-coaches received weekly group and individual supervision with review of the “live” groups and responding to posts together using MI.
To assess fidelity in group transcripts, we adapted codes from the MI Treatment Integrity (MI) and MI Skills Code (MISC). Staff coded a randomly selected 2 days per week from each intervention group and coded that day’s e-coach posts/responses (n=562; each could have multiple codes) for MI fidelity. Non-adherent confronting/persuading did not occur at all in selected posts (0.0%); adherent affirmations/support occurred frequently (61.4%). Complex reflections occurred in 47.9% of posts and simple reflections were coded in 17.1% of posts (i.e., 73.7% of reflections were complex). Questions were coded in 31.5%, resulting in a good reflection-to-question ratio (2.06:1). Given the nature of social media, e-coaches used a strategy we termed “personal share” wherein they briefly used personal experience (e.g., coping with a bad day, consequences of cannabis consumption among people they knew) to illustrate intervention concepts and encourage participants’ reactions. This was coded in 12.8% of comments. To assess reliability, staff double-coded 20% of posts and replies/comments with kappas as follows: simple reflection = .75, complex reflections =.86, affirmation/support =.94, questions =1.00, and personal share = .88.
2.5. Measures
2.5.1. Eligibility and descriptive information.
We queried demographics to determine eligibility and describe the sample using items from prior studies (Kann et al., 2014; Stoddard et al., 2012). Participants completed two-item screeners for two-week depression and anxiety symptoms (cut-off scores of ≥ 3; (Kroenke et al., 2003; Plummer et al., 2016; Skapinakis, 2007). Participants chose their state residence to determine residence with/without legal recreational cannabis.
In the screening survey, we described varied forms of cannabis use, and to avoid reporting on products sold as “CBD only”, used this introduction : “Next we will ask you about marijuana use. This includes any marijuana products that contain THC including flower in joints, blunts, bowls; dabs/wax/shatter/budder or other concentrates; oil or flower in vaporizers; edibles and tinctures; and skincare products such as lotions. Do not include products that contain only CBD.” Cannabis eligibility was assessed with an item modified from prior work (Cuttler and Spradlin, 2017): “Which of the following best captures the average frequency you used marijuana or marijuana products in the past month?” Response options were: never, once, 2–3 times, once a week, twice a week, 3–4 times a week, 5–6 times a week, once a day, and more than once a day. Participants selecting “3–4 times a week” or greater were eligible for enrollment.
2.5.2. Cannabis consumption.
We used an online Timeline Follow Back (TLFB) (Martin-Willett et al., 2020; Martin-Willett et al., 2019) embedded in Qualtrics surveys to assess past 30-day use of cannabis across four modalities (i.e., smoking, vaping, dabbing, eating). Participants first completed a calendar designating anchors (e.g., holidays, personal events), then entered their cannabis use separately for each modality consumed. They reported number of times used per day and, using pictorial aids for flower, dabs, and vapes, estimated quantity consumed per day (converted to grams for analysis). For analysis, we computed past 30-day totals (days, grams, times used) for each modality separately and combined.
2.5.3. Alcohol Consumption and Co-Use.
Our TLFB also prompted participants who reported past 30-day alcohol consumption to enter their estimated daily standard drinks (pictorial guide provided). We constructed summary variables for total alcohol use days and total estimated standard drinks among those reporting baseline consumption. We also calculated number of co-use days (alcohol+cannabis).
2.5.4. Intervention acceptability and engagement.
At 3-months, participants received questions assessing acceptability (e.g., e-coach helpfulness, helpfulness of peer interaction) rated on 5-point Likert scales (1=Not at all to 5=Extremely). A single item queried likelihood of recommending the group (1–10 scale) and 4 items queried satisfaction with different types of content (1=Not at all to 5=Extremely). To quantify engagement, we also separately tallied the number of comments/posts and reactions (e.g., likes, hearts) left by participants.
2.6. Statistical Analysis
We computed means, standard deviations, and proportions for descriptive analyses, including percent change from baseline for cannabis and alcohol consumption outcomes at 3- and 6-months. We used independent samples t-tests and chi-square analyses to compare the intervention and control groups on baseline demographics and cannabis consumption, acceptability and engagement (comments, reactions). Additionally, we used independent samples t-tests to compare individuals missing at 3- and 6-months follow-ups to those retained on baseline cannabis consumption. To examine preliminary effects of the intervention on consumption, we fixed linear mixed effects models adjusted for baseline measurement of the outcome and balancing factors (i.e., age group, sex, recreational cannabis legality), and included a random intercept for assigned group, to adjust for the fact that this an individually-randomized group treatment trial. We tested for treatment effects by conducting a two-sided test of the coefficient for the treatment/control indicator and estimated the Cohen’s D (the mean difference between the two groups at follow-up divided by the total variation not captured by the fixed effects) and 95% confidence intervals. Separate treatment effects were estimated for 3- and 6-month follow-ups to inform future trial design; 14 participants who did not complete the 3-month follow-up, and 16 who did not complete the 6-month follow-up were excluded from those models, respectively.
3. Results
3.1. Trial Feasibility
Figure 2 shows the study flow chart; 2,229 individuals completed screening (eligibility rate=77.2%). Of those, 349 were invited to complete RCT consent and baseline survey. Among the 212 who opened the email invitation and consented, 158 completed the baseline (74.5%) and 149 were fully-enrolled, randomized (N=76 intervention; N=73 control), and invited to join a group (N=1 per condition did not join). The 149 fully-enrolled did not significantly differ from the 63 who consented but did not complete enrollment on age, race, or cannabis use frequency; however, females were more likely to fully enroll (55.7% among enrolled, 31.8% among not fully-enrolled; p=.001).
Figure 2.
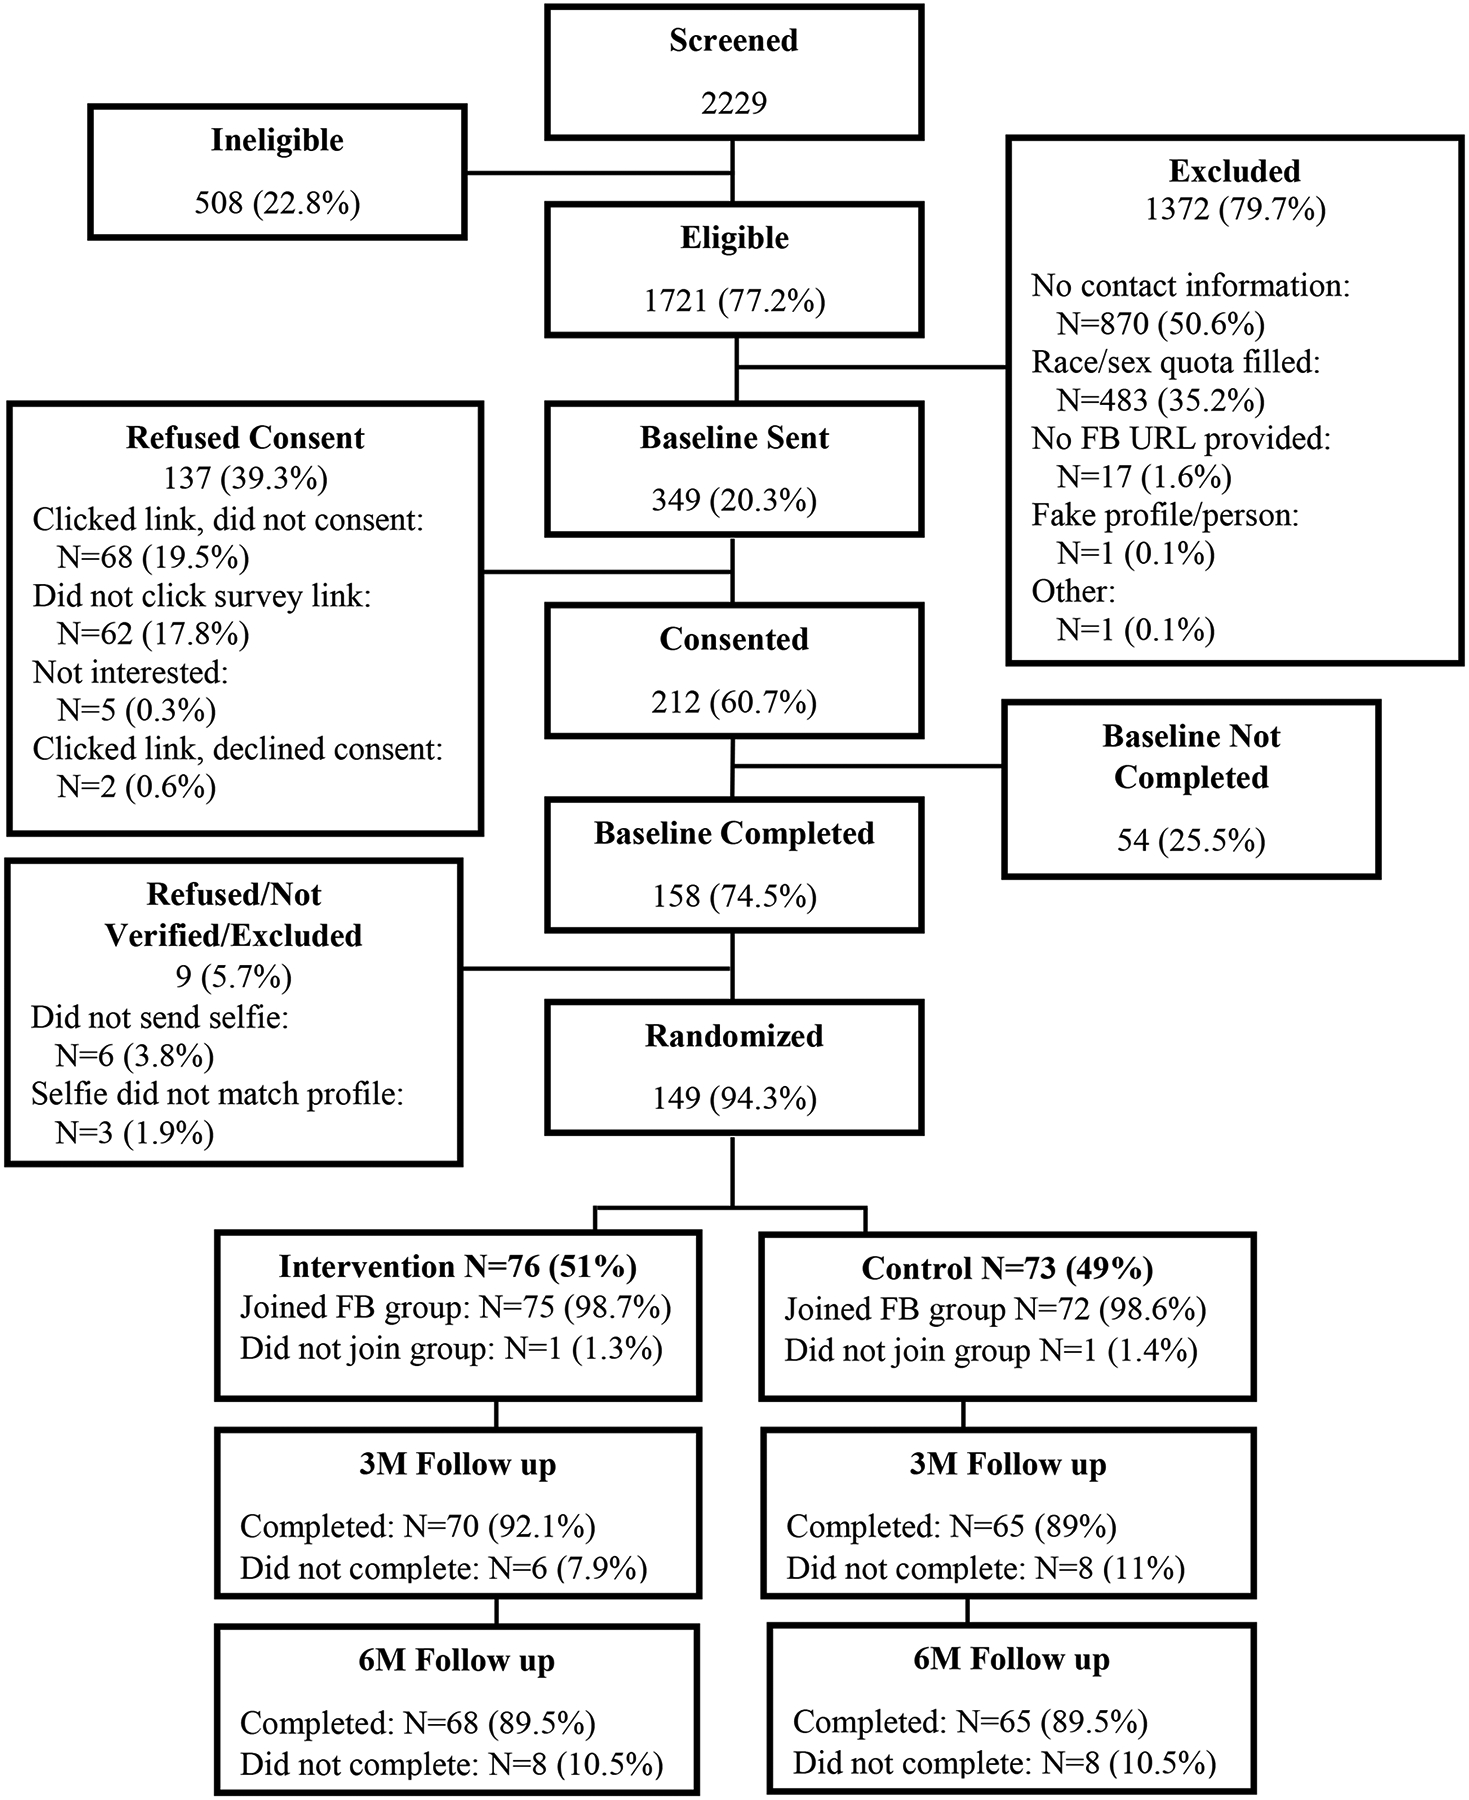
Study Flow
Individuals were recruited from non-legal cannabis states and states with legal cannabis access, with per-wave advertising costs totaling $2,484.12 and $1,067.52, respectively. Advertising costs per-participant enrolled and randomized was $23.83. Wave 1’s baseline also involved mailing UDS kits in unmarked packages to participants (84% completed and submitted results; 93% were cannabis positive and consistent with self-report).
Follow-up rates were 92.1% in the intervention and 89.0% in the control group at 3-months (89.5% and 89.5%, respectively at 6-months). When examining differences in baseline cannabis consumption between those who completed follow-up and those who did not there were only three statistically significant differences which had to do with smoking (as opposed to times used, days used, and quantity of total consumption or across all other modalities at 3- and 6-months). Individuals who completed the 3-month follow-ups smoked a greater number of days (M=17.25, SD=21.14 vs. M=9.39, SD=8.18; p=0.009) and a greater number of times (M=43.93, SD=55.12 vs. M=24.21, SD=24.10; p=0.019) than individuals who did not complete. Participants completing the 6-month follow-up smoked more days than those who did not complete (M=17.17, SD=21.33 vs. M=10.98, SD=8.03; p=0.028).
3.2. Participant Characteristics at Baseline
RCT participants were M=21.0 years old (SD=2.2) and 55.7% reported biological female sex; 70.5% were White, 20.1% were Black/African American, and 9.4% were of other racial backgrounds, with 20.1% being Hispanic/Latinx. At enrollment, 51.7% resided in a state with legal recreational cannabis, and 48.3% did not. Cannabis use eligibility based on past-3-month frequency (0=never, 8=more than once a day) had a sample mean = 7.2 (SD=1.1). Additional details are in Tables 2 and 3.
Table 2.
Descriptive characteristics of the sample by group
| Total Sample N = 149 M (SD) or N (%) |
Control N=73 M (SD) or N (%) |
Intervention N=76 M (SD) or N (%) |
|
|---|---|---|---|
| Age | 21.0 (2.2) | 20.9 (2.0) | 21.2 (2.3) |
| Female sex | 83 (55.7%) | 40 (54.8%) | 43 (56.6%) |
| Male sex | 66 (44.3% | 33 (45.2%) | 33 (43.4%) |
| Gender identity | |||
| Male | 63 (42.3%) | 31 (42.5%) | 32 (42.1%) |
| Female | 71 (47.7%) | 36 (49.3%) | 35 (46.1%) |
| Trans Man | 6 (4.0%) | 3 (4.1%) | 3 (4.0%) |
| Trans Woman | 1 (0.7%) | 0 (0.0%) | 1 (1.3) |
| Other identities (e.g., non-binary genderqueer, etc.) | 8 (5.4%) | 3 (4.1%) | 5 (6.6%) |
| Race | |||
| Black/African American | 30 (20.1%) | 15 (20.6%) | 15 (19.7%) |
| White | 105 (70.5%) | 51 (69.9%) | 54 (71.1%) |
| Other | 14 (9.4%) | 7 (9.6%) | 7 (9.2%) |
| Hispanic/Latinx | 30 (20.1%) | 13 (17.1%) | 17 (23.3%) |
| Highest Education | |||
| Less than high school | 5 (3.4%) | 2 (2.7%) | 3 (4.0%) |
| Completed high school | 34 (22.8%) | 14 (19.2%) | 20 (26.3%) |
| Some college/tech school | 84 (56.4%) | 41 (56.2%) | 43 (56.6%) |
| Completed college or higher | 10 (13.2%) | 16 (21.9%) | 10 (13.2%) |
| Job status | |||
| Not working | 68 (45.6%) | 30 (41.0%) | 38 (50.0%) |
| Full time work (30+ hrs/week) | 37 (24.8%) | 18 (24.6%) | 19 (25.0%) |
| Part time work (< 30 hrs/week) | 41 (27.5%) | 27 (36.9%) | 14 (18.4%) |
| Other (e.g., disability, internship) | 11 (7.4%) | 2 (2.7%) | 8 (11.8%) |
| State recreational cannabis | |||
| Recreational cannabis | 77 (51.7%) | 39 (53.4%) | 38 (50.0%) |
| No recreational cannabis | 72 (48.3%) | 34 (46.6%) | 38 (50.0%) |
| Past-month cannabis frequencya | 7.2 (1.1) | 7.1 (1.1) | 7.2 (1.1) |
| Positive anxiety screening | 67 (45.0%) | 31 (42.5%) | 36 (47.4%) |
| Positive depression screen | 63 (42.3%) | 33 (45.2%) | 30 (39.5%) |
| Facebook frequencyb | 5.0 (1.1) | 5.0 (1.2) | 5.1 (1.1) |
| Instagram frequencyb | 4.9 (1.4) | 5.2 (1.0) | 4.7 (1.7) |
| Snapchat frequencyb | 4.7 (1.6) | 4.8 (1.5) | 4.7 (1.7) |
| Twitter frequencyb | 3.2 (2.1) | 3.2 (2.0) | 3.2 (2.2) |
0= Never, 1= Once, 2= 2 – 3 times, 3= Once a week, 4= Twice a week, 5= 3 – 4 times a week, 6= 5 – 6 times a week, 7= Once a day, 8= More than once a day
1= Never, 2= Less Than Monthly, 3= Monthly, 4= Weekly, 5= Daily or Almost Daily, 6= Several times a day
Table 3.
Cannabis, alcohol, and cannabis/alcohol co-use at baseline, 3-months, and 6-months follow-up (Intervention Group = I, Control Group = C)
| Baseline (N=149) M (SD) |
3-Months (N=135) M (SD) |
3-Month Model Results (Cohen’s D, CI) and % Change from Baseline | 6-Months (N=133) M (SD) |
6-Month Model Results (Cohen’s D, CI) and % Change from Baseline | |
|---|---|---|---|---|---|
| Overall Consumption | |||||
| Total times used cannabis | |||||
| D = −.15 (−.61,.31), p = .40 | D = .26 (−.20,.72), p = 0.14 | ||||
| I | 106.1 (131.0) | 76.4 (88.5) | −28.0% | 74.2 (103.3) | −30.1% |
| C | 80.7 (158.0) | 57.9 (96.3) | −28.2% | 86.2 (169.8) | +6.8% |
| Total quantity | |||||
| D = −.10 (−.45,.25), p = .57 | D = .06 (−.29, .42), p = .72 | ||||
| I | 21.5 (22.3)* | 19.8 (26.7) | −7.9% | 15.5 (21.7) | −27.9% |
| C | 13.1 (17.6) | 11.6 (15.6) | −11.5% | 11.5 (15.0) | −12.2% |
| Total cannabis use days | |||||
| D = −.01 (−.48, .47), p = .98 | D = .26 (−.09, .62), p = .14 | ||||
| I | 20.8 (9.3)* | 18.0 (11.5) | −13.5% | 16.8 (12.2) | −19.2% |
| C | 16.7 (11.1) | 14.9 (11.7) | −10.8% | 15.8 (11.8) | −5.1% |
| Smoking Outcomes | |||||
| Total days smoked | |||||
| D = −.09 (−.52, .34), p = .70 | D =.12 (−.24, .48), p = .51 | ||||
| I | 16.5 (10.6)** | 14.7 (11.8) | −10.9% | 12.9 (12.4) | −21.8% |
| C | 10.7 (11.0) | 9.9 (11.3) | −7.5% | 10.1 (11.1) | −5.6% |
| Total times smoked | |||||
| D = −.25 (−.60, .10), p =.16 | D = −.17 (−.52,.19), p = .35 | ||||
| I | 50.5 (55.1)* | 44.2 (56.2) | −12.5% | 39.3 (52.7) | −22.2% |
| C | 32.8 (49.8) | 25.0 (34.3) | −23.8% | 28.5 (42.4) | −13.1% |
| Total quantity smoked | |||||
| D = −.09 (−.44, .25), p =.60 | D = .04 (−.31, .41), p = .82 | ||||
| I | 20.3 (22.3)* | 18.9 (26.4) | −6.9% | 14.4 (21.1) | −29.1% |
| C | 12.4 (17.4) | 11.1 (15.8) | −10.5% | 10.7 (15.0) | −10.5% |
| Vaping Outcomes | |||||
| Total days vaped | |||||
| D = .12 (−.22, .47), p = .48 | D = .40, (.05, .75), p = .02 | ||||
| I | 4.6 (7.2) | 3.1 (6.1) | −32.6% | 2.6 (5.6) | −43.5% |
| C | 4.8 (8.4) | 4.0 (6.8) | −16.7% | 5.6 (9.6) | +16.7% |
| Total times vaped | |||||
| D = .20 (−.14, .55), p = .25 | D = .28, (−.07, .63), p = .11 | ||||
| I | 19.7 (47.6) | 8.7 (17.4) | −55.8% | 9.3 (23.2) | −52.8% |
| C | 20.7 (59.8) | 13. 7 (26.5) | −33.8% | 32.3 (118.3) | +56.1% |
| Total quantity vaped | |||||
| D = .16, (−.18, .51), p =.35 | D = .15, (−.20, .50) p = .39 | ||||
| I | 0.1 (0.3) | 0.04 (0.1) | −60.0% | 0.06 (0.2) | −40.0% |
| C | 0.1 (0.3) | 0.06 (0.1) | −40.0% | 0.09 (0.3) | −10.0% |
| Dabbing Outcomes | |||||
| Total days dabbed | |||||
| D = −.01, (−.35, .33), p = .94 | D = .15, (−.29, .58) p = .53 | ||||
| I | 4.7 (9.6) | 4.6 (9.3) | −2.1% | 4.6 (9.7) | −2.1% |
| C | 3.1 (7.7) | 3.0 (7.7) | −3.2% | 3.8 (8.4) | +22.6% |
| Total times dabbed | |||||
| D = .00, (−.34, .35), p = .99 | D = .15 (−.20, .50), p = .39 | ||||
| I | 33.8 (104.9) | 21.3 (66.8) | −37.0% | 24.7 (70.4) | −26.9% |
| C | 23.9 (115.1) | 18.3 (91.4) | −23.4% | 23.8 (117.0) | −0.4% |
| Total quantity dabbed | |||||
| D = −.03, (−.42, .35), p = .87 | D = .11, (−.29, .51), p = .60 | ||||
| I | (3.0) | 0.7 (2.2) | −36.4% | 0.9 (2.5) | −18.2% |
| C | 0.7 (2.6) | 0.5 (1.7) | −28.6% | 0.6 (2.1) | −14.3% |
| Edibles Outcomes | |||||
| Total days used edibles | |||||
| D = −.29, (−.72, .13) p = .23 | D = .12, (−.22, .47), p = .48 | ||||
| I | 1.8 (4.1) | 1.5 (3.3) | −16.7% | 0.8 (2.1) | −55.6% |
| C | 2.0 (4.8) | 0.9 (2.4) | −55.0% | 1.3 (3.6) | −35.0% |
| Total times used edibles | |||||
| D = −.27, (−.74, .19) p = .29 | D = .14, (−.21, .50), p = .42 | ||||
| I | 2.1 (4.8) | 2.1 (4.5) | 0.0% | .9 (2.4) | −57.1% |
| C | 3.7 (14.1) | 1.0 (2.8) | −73.0% | 1.7 (4.3) | −54.0% |
| Total quantity of edibles | |||||
| D = −.22, (−.57, .12), p = .20 | D = −.12, (−.59, .36), p =.65 | ||||
| I | .08 (.15) | .14 (.45) | +75.0% | .14 (.71) | +75.0% |
| C | .09 (.27) | .05 (.20) | −44.4% | .05 (.20) | −44.4% |
| Alcohol-Related Outcomes | |||||
| Total alcohol use days a | |||||
| D = −.11, (−.53, .31), p = .60 | D = .16, (−.27, .60) p = .46 | ||||
| I | 6.2 (6.7) | 6.0 (8.0) | −3.2% | 4.9 (7.6) | −20.1% |
| C | 7.2 (7.2) | 6.1 (8.1) | −15.5% | 6.5 (7.8) | −15.3% |
| Total alcohol drinks a | |||||
| D =−.27, (−.69, .16), p = .21 | D = −.11, (−.54,.32), p =.62 | ||||
| I | 15.9 (15.6) | 17.1 (28.1) | +7.5% | 14.3 (27.5) | −10.1% |
| C | 17.4 (18.3) | 12.4 (15.4) | −28.7% | 13.5 (15.8) | −22.4% |
| Total alcohol+cannabis co-use days a | |||||
| D = −0.25, (−.72,.23), p =.18 | D = 31, (−.13, 0.75), p =.16 | ||||
| I | 5.7 (6.5) | 5.4 (7.6) | −5.3% | 3.8 (6.7) | −33.3% |
| C | 5.9 (6.3) | 4.1 (6.0) | −30.5% | 5.6 (8.0) | −5.1% |
restricted those reporting alcohol use at baseline (N = 59 intervention, N = 43 control)
restricted to those reporting co-use days at baseline (N = 58 intervention, N = 41 control)
p<.01 for tests of baseline equivalence;
p<.05 for tests of baseline equivalence
Descriptively, smoking was the most common modality reported (Intervention [I]=93%, Control [C]=87%), followed by vaping (I=57%, C=55%), edibles (I=46%, C=39%), and dabbing (I=42%, C=34%). Regarding alcohol use, 78% of the intervention group and 61% of the control group drank, with 76% and 59%, respectively, reporting past-month same day cannabis+alcohol co-use. Many met screening criteria for depression (42.3%) or anxiety (45.0%). There were no significant differences between conditions on the variables in Table 2. Independent samples t-tests showed that baseline means on the following variables were significantly higher among the intervention group vs. the control group (denoted in Table 3): total cannabis frequency (times used; p=0.012), total cannabis use days (p=.043), total days smoked cannabis (p=0.001), total frequency of cannabis smoking (times used; p=.043), and total quantity smoked (p=0.018). No other cannabis variables differed at baseline between groups.
3.3. Intervention Engagement and Acceptability
Table 4 displays engagement and acceptability metrics. The intervention group displayed significantly greater interaction group versus the Control group, both in terms of posting/commenting and clicking reactions (e.g., M = 28.1 posts per intervention participant over 8 weeks vs. 1.4 for the control group); overall intervention participants engaged M = 47.9 times each over 8 weeks. On all items regarding e-coaches and their approach, intervention participants gave significantly higher ratings than control participants (e.g., helpfulness: M=3.5 vs. 2.6; respect: M=4.5 vs. 3.9). There were no significant differences between groups on content ratings. Intervention participants were significantly more likely to recommend the group (M=6.4 vs. M=5.3).
Table 4.
Eight-week engagement metrics and 3-month acceptability ratings by intervention and control groups
| Control N=65 M (SD) |
Intervention N=70 M (SD) |
|
|---|---|---|
| Engagement (Mean per participant over 8 weeks) | ||
| Posts/comments*** | 1.4 (3.6) | 28.1 (46.3) |
| Reactions (e.g., likes, hearts)* | 9.5 (15.5) | 19.8 (38.3) |
| Total*** | 10.9 (17.6) | 47.9 (82.8) |
| Acceptability | ||
| Coach ratings | ||
| How helpful were the e-coaches?a*** | 2.6 (1.3) | 3.5 (1.0) |
| How helpful was it to interact with other peers in the group?a** | 2.2 (1.3) | 2.9 (1.3) |
| I felt the e-coaches were caring, supportive, and warma** | 3.6 (1.2) | 4.2 (0.9) |
| I felt the e-coaches treated me with respecta*** | 3.9 (1.2) | 4.5 (0.6) |
| I felt the e-coaches understood mea,b* | 3.1 (1.3) | 3.6 (1.1) |
| Content ratings | ||
| I enjoyed the memesa | 3.6 (1.4) | 3.6 (1.2) |
| I enjoyed the quizzesa | 2.9 (1.5) | 3.2 (1.2) |
| I enjoyed the news articlesa | 2.9 (1.3) | 3.4 (1.2) |
| I enjoyed the videosa | 2.9 (1.4) | 3.1 (1.2) |
| Overall rating | ||
| How likely is it that you would recommend the group to someone you know?b,c* | 5.3 (3.2) | 6.4 (2.7) |
Response scale: 1 = not at all, 2 = a little, 3 = somewhat, 4 = very much, 5 = extremely
1 person did not complete this item and therefore had missing data.
Range = 1 to 10
p <.05;
p <.01;
p <.001
3.4. Cannabis and Alcohol Consumption Outcomes
Outcomes at 3- and 6-months are in Table 3, including percent reduction and results of adjusted models across total consumption and separated by modalities. Descriptively, at 3-months (1 month after the 8-week intervention ended), changes in cannabis consumption often showed similar reductions in both conditions with adjusted models showing non-significant results. Focusing on overall consumption at 3-months, the intervention and control groups both had 28% reductions in total times used cannabis, the intervention group reduced total estimated quantity by 7.9% (control group by 11.5%), and the number of cannabis use days declined 13.5% in the intervention (control=10.8%). When focusing on changes for different cannabis modalities (Table 3), in some cases, at 3-months, there were larger reductions in the control group (e.g., total times smoked −23.8% for control vs. −12.5%) whereas, in other cases, reductions were greater for intervention participants (e.g., total times vaped: 55.8% for intervention, −33.8% for control).
Focusing on overall consumption, compared to baseline, at 6-months the intervention group had reduced total frequency of cannabis use by 30.1% (control group increased 6.8%; ns adjusted model) and total days of cannabis use by 19.2% (vs. 5.1% control group reduction; ns adjusted model). For total estimated quantity the intervention group reduced by 27.8% and the control group by 12.2% (ns adjusted model). At 6-months, descriptive patterns across modalities (Table 3) showed generally greater reductions for intervention participants versus the control group for cannabis measures. There was inconsistency with regard to edibles: the intervention group reported reduced days and times used, but increased quantity consumed, though these changes were non-significant in adjusted models. The only adjusted model with a statistically significant difference between groups involved total days of vaping, where the control group increased by 16.7% and the intervention group decreased by 43.5% (D=.40, 95% Confidence Interval=0.05–0.75, p=0.020).
Although alcohol was a secondary focus, and not all participants drank alcohol, models focused on alcohol use and co-use days were non-significant. Descriptively, reductions in alcohol use days were similar for each group at 6-months (-20.1% intervention, −15.3% control), whereas co-use days declined by 33.3% for intervention participants (-5.1% in the control group). None of the alcohol-related adjusted models were significant.
4. Discussion
This study demonstrated feasibility and acceptability of an RCT for a social media-based intervention targeting cannabis use among emerging adults. Consistent with calls to use this highly-accessed medium in prevention (Merchant, 2020), our intervention showed promise and we recommend examination in a fully-powered trial. First, the intervention was rated more positively than the control, which may reflect the MI style of facilitating rapport and trust in a non-judgmental atmosphere that is supported by our fidelity data. This is notable because intervention participants were non-treatment seeking. Importantly, intervention participants also engaged with the provided content throughout 8 weeks (e.g., M = 28 posts per participant), to a greater extent than those in the attention-control group, further demonstrating acceptability as participants gave more comments/posts than simply clicking a like/reaction button. In comparison, earlier group-based social media intervention studies related to substance use averaged 9 (EAs with tobacco use, including incentivized posting strategies in some conditions; (Thrul et al., 2015) to 15 (adult patients with chronic pain on opioids; (Young et al., 2018) posts per person over a 3-month period.
Next, this RCT was feasible with a high eligibility rate, likely due to targeted advertising, and low attrition. Although the baseline completion rate (45%) was lower than fully-powered trials, this may due to limited pilot staffing as more staff delivering reminders via e-mails, phone calls, and texting helped us achieve a higher rate (66%) in a similar-aged nationally-recruited sample in a larger fully-staffed RCT (Bonar et al., 2020). Others have reported similar rates (55%) with youth (Guest et al., 2021), while noting that many online-screened individuals do not provide adequate contact information, or fail to open e-mailed invitations or surveys, reflecting a challenge of national electronic-based recruitment. Nonetheless, the per-participant cost ($23.83) provides feasibility data for future studies. Such costs were less than recent Facebook-based trials involving of youth/young adults ($68.75) (Zlotorzynska et al., 2021) and on the lower end of the range in other trials recruiting on social media ($1.51 - $172.76) (Topolovec-Vranic and Natarajan, 2016).
Regarding behavioral outcomes, pilot trials are useful to inform larger efficacy trials, but estimates are potentially under-powered with large standard errors leading to possible under-estimation of true effect sizes (Kraemer et al., 2006; Leon et al., 2011). Noting such caveats, our results generally show greater declines for intervention participants versus control participants in most cannabis measures at 6-months (e.g., 30% decline in total times used, 19% decline in days used; 20–30% declines across smoking measures) with modest estimated effect sizes. These declines are encouraging for a future efficacy trial, particularly given the prevalence of smoking and the statistically significant medium-sized effect for total days of vaping. This is the first intervention documented to decrease cannabis vaping in a rigorous RCT design, which is key given the recent increases in vaping (Palamar, 2021) and associated high potency (Chadi et al., 2020). Further, reductions in cannabis use emerged more consistently at 6-months, than at 3-months as this assessment occurred only one month after intervention end, suggesting potentially longer-term behavior changes post-intervention. A RCT with a longer follow-up period could examine whether reductions are maintained, or different intervention lengths could be tested to determine the impact of dose.
Using the TLFB for estimated quantity (using pictorial aids) and frequency of cannabis is a strength of this investigation. Despite concerns some researchers have about self-report, self-report of substance use is valid (Simons et al., 2015), as is online TLFB administration (Hjorthøj et al., 2012; Martin-Willett et al., 2020; Martin-Willett et al., 2019). Nonetheless, this approach has potential limitations because estimating quantity of cannabis products is challenging across modalities and there is no gold standard, validated quantity measure (Loflin et al., 2020). Measurement challenges regarding edibles (e.g., unknown potency if home-made, wide variation of product potency, lack of pictures due to variations) exist and it’s also possible that participants could reduce the frequency of edibles while increasing quantity or substituting with other modalities. Nonetheless, our novel TLFB involved measures of days used and times used per day across modalities, consistent with expert consensus (Loflin et al., 2020).
Although we recruited online and nationally, with representation from varied racial/ethnic groups, results may not generalize to the larger population or to those who do not use social media regularly. While it is a strength to engage EAs outside of college settings (i.e., 56% reported their highest education level was some college/technical school, suggesting up to half of participants were not actively in college when recruited), we did not assess current college involvement. Next, this pilot RCT is under-powered, and thus behavioral outcomes should be interpreted cautiously. Finally, we did not compare participants across non-legal (Wave 1) and legal (Wave 2) state types given that the COVID-19 pandemic also occurred during Wave 1, potentially confounding comparisons.
In the context of increasing EA cannabis consumption and legality, accessible, scalable, and acceptable interventions are needed. Our social media-based intervention could meet such needs, particularly in an era of increased telehealth due to COVID-19. If proven efficacious, this approach has potential to be engaging to young people given that our participants were only incentivized for assessments and not for participation in the groups. Although other issues associated with implementation of prevention-focused programs would need to be considered based on setting (e.g., reach, adoption), sustained prevention-focused resources are needed to reach people at this critical developmental juncture. Further, this manualized approach shares common elements of social media which support delivery over future platforms and can be easily updated over time for changing trends without expensive costs of software programming. Thus, we recommend future testing of this novel and promising approach.
Acknowledgements:
We wish to thank the participants and staff members who made this study possible.
Funding Sources:
This study was funded by a grant from the NIDA #045067.
Footnotes
COIs: The authors do not have any personal financial interests related to this manuscript, with 2 exceptions. MW is a minor shareholder in Facebook and has a conflict of interest plan approved by the University of Michigan. SY has received an unrestricted gift from Facebook, on file with the University of California, Los Angeles (his prior academic appointment).
References
- Arnett JJ, 2000. Emerging adulthood: A theory of development from the late teens through the twenties. Am. Psychol 55(5), 469–480. [PubMed] [Google Scholar]
- Arnett JJ, 2005. The developmental context of substance use in emerging adulthood. Journal of Drug Issues 35(2), 235–254. [Google Scholar]
- Arterberry BJ, Boyd CJ, West BT, Schepis TS, McCabe SE, 2020. DSM-5 substance use disorders among college-age young adults in the United States: Prevalence, remission and treatment. J. Am. Coll. Health 68(6), 650–657. [DOI] [PMC free article] [PubMed] [Google Scholar]
- Auxier B, Anderson M, 2021. Social media use in 2021. Pew Research Center. [Google Scholar]
- Azofeifa A, Mattson ME, Schauer G, McAfee T, Grant A, Lyerla R, 2016. National estimates of marijuana use and related indicators - National Survey on Drug Use and Health, United States, 2002–2014. MMWR Surveill. Summ 65(11), 1–25. [DOI] [PubMed] [Google Scholar]
- Bauermeister JA, Pingel E, Zimmerman M, Couper M, Carballo-Dieguez A, Strecher VJ, 2012. Data quality in HIV/AIDS web-based surveys: Handling invalid and suspicious data. Field methods 24(3), 272–291. [DOI] [PMC free article] [PubMed] [Google Scholar]
- Behrendt S, Wittchen HU, Hofler M, Lieb R, Beesdo K, 2009. Transitions from first substance use to substance use disorders in adolescence: Is early onset associated with a rapid escalation? Drug Alcohol Depend. 99(1–3), 68–78. [DOI] [PubMed] [Google Scholar]
- Bernstein E, Edwards E, Dorfman D, Heeren T, Bliss C, Bernstein J, 2009. Screening and brief intervention to reduce marijuana use among youth and young adults in a pediatric emergency department. Acad. Emerg. Med 16(11), 1174–1185. [DOI] [PMC free article] [PubMed] [Google Scholar]
- Bonar EE, Chapman L, McAfee J, Goldstick JE, Bauermeister JA, Carter PM, Young SD, Walton MA, 2021. Perceived impacts of the COVID-19 pandemic on cannabis-using emerging adults. Transl. Behav. Med 11(7), 1299–1309. [DOI] [PMC free article] [PubMed] [Google Scholar]
- Bonar EE, Schneeberger DM, Bourque C, Bauermeister JA, Young SD, Blow FC, Cunningham RM, Bohnert AS, Zimmerman MA, Walton MA, 2020. Social Media Interventions for Risky Drinking Among Adolescents and Emerging Adults: Protocol for a Randomized Controlled Trial. JMIR Res Protoc 9(5), e16688. [DOI] [PMC free article] [PubMed] [Google Scholar]
- Bull SS, Levine DK, Black SR, Schmiege SJ, Santelli J, 2012. Social media-delivered sexual health intervention: A cluster randomized controlled trial. Am. J. Prev. Med 43(5), 467–474. [DOI] [PMC free article] [PubMed] [Google Scholar]
- Carliner H, Brown QL, Sarvet AL, Hasin DS, 2017. Cannabis use, attitudes, and legal status in the U.S.: A review. Prev. Med [DOI] [PMC free article] [PubMed] [Google Scholar]
- Cash MC, Cunnane K, Fan C, Romero-Sandoval EA, 2020. Mapping cannabis potency in medical and recreational programs in the United States. PLoS One 15(3), e0230167. [DOI] [PMC free article] [PubMed] [Google Scholar]
- Castellanos-Ryan N, Pingault JB, Parent S, Vitaro F, Tremblay RE, Seguin JR, 2016. Adolescent cannabis use, change in neurocognitive function, and high-school graduation: A longitudinal study from early adolescence to young adulthood. Dev. Psychopathol 29, 1253–1266. [DOI] [PMC free article] [PubMed] [Google Scholar]
- Chadi N, Minato C, Stanwick R, 2020. Cannabis vaping: Understanding the health risks of a rapidly emerging trend. Paediatr. Child Health 25(Suppl 1), S16–s20. [DOI] [PMC free article] [PubMed] [Google Scholar]
- Cuttler C, Spradlin A, 2017. Measuring cannabis consumption: Psychometric properties of the Daily Sessions, Frequency, Age of Onset, and Quantity of Cannabis Use Inventory (DFAQ-CU). PLoS One 12(5), e0178194. [DOI] [PMC free article] [PubMed] [Google Scholar]
- ElSohly MA, Chandra S, Radwan M, Gon C, Church JC, 2021. A Comprehensive Review of Cannabis Potency in the USA in the Last Decade. Biol Psychiatry Cogn Neurosci Neuroimaging. [DOI] [PubMed] [Google Scholar]
- ElSohly MA, Mehmedic Z, Foster S, Gon C, Chandra S, Church JC, 2016. Changes in Cannabis Potency Over the Last 2 Decades (1995–2014): Analysis of Current Data in the United States. Biol. Psychiatry 79(7), 613–619. [DOI] [PMC free article] [PubMed] [Google Scholar]
- Freeman TP, Craft S, Wilson J, Stylianou S, ElSohly M, Di Forti M, Lynskey MT, 2021. Changes in delta-9-tetrahydrocannabinol (THC) and cannabidiol (CBD) concentrations in cannabis over time: systematic review and meta-analysis. Addiction 116(5), 1000–1010. [DOI] [PubMed] [Google Scholar]
- Gmel G, Gaume J, Bertholet N, Flückiger J, Daeppen JB, 2013. Effectiveness of a brief integrative multiple substance use intervention among young men with and without booster sessions. J. Subst. Abuse Treat 44(2), 231–240. [DOI] [PubMed] [Google Scholar]
- Guest JL, Adam E, Lucas IL, Chandler CJ, Filipowicz R, Luisi N, Gravens L, Leung K, Chavanduka T, Bonar EE, Bauermeister JA, Stephenson R, Sullivan PS, 2021. Methods for Authenticating Participants in Fully Web-Based Mobile App Trials from the iReach Project: Cross-sectional Study. JMIR mHealth uHealth 9(8), e28232. [DOI] [PMC free article] [PubMed] [Google Scholar]
- Gutierrez KM, Cooper TV, 2016. The use of social networking sites: A risk factor for using alcohol, marijuana, and synthetic cannabinoids? Drug Alcohol Depend. 163, 247–250. [DOI] [PubMed] [Google Scholar]
- Hall W, Degenhardt L, 2009. Adverse health effects of non-medical cannabis use. Lancet 374, 1383–1391. [DOI] [PubMed] [Google Scholar]
- Hall W, Lynskey M, 2020. Assessing the public health impacts of legalizing recreational cannabis use: the US experience. World Psychiatry 19(2), 179–186. [DOI] [PMC free article] [PubMed] [Google Scholar]
- Halladay J, Scherer J, MacKillop J, Woock R, Petker T, Linton V, Munn C, 2019. Brief interventions for cannabis use in emerging adults: A systematic review, meta-analysis, and evidence map. Drug Alcohol Depend. 204, 107565. [DOI] [PubMed] [Google Scholar]
- Hjorthøj CR, Hjorthøj AR, Nordentoft M, 2012. Validity of Timeline Follow-Back for self-reported use of cannabis and other illicit substances--systematic review and meta-analysis. Addict. Behav 37(3), 225–233. [DOI] [PubMed] [Google Scholar]
- Imtiaz S, Roerecke M, Kurdyak P, Samokhvalov AV, Hasan OSM, Rehm J, 2020. Brief Interventions for Cannabis Use in Healthcare Settings: Systematic Review and Meta-analyses of Randomized Trials. J. Addict. Med 14(1), 78–88. [DOI] [PubMed] [Google Scholar]
- Jones CB, Hill ML, Pardini DA, Meier MH, 2016. Prevalence and correlates of vaping cannabis in a sample of young adults. Psychol. Addict. Behav 30(8), 915–921. [DOI] [PubMed] [Google Scholar]
- Kann L, Kinchen S, Shanklin SL, Flint KH, Kawkins J, Harris WA, Lowry R, Olsen EO, McManus T, Chyen D, Whittle L, Taylor E, Demissie Z, Brener N, Thornton J, Moore J, Zaza S, 2014. Youth risk behavior surveillance--United States, 2013. MMWR Surveill. Summ. 63 Suppl 4, 1–168. [PubMed] [Google Scholar]
- Kraemer HC, Mintz J, Noda A, Tinklenberg J, Yesavage JA, 2006. Caution regarding the use of pilot studies to guide power calculations for study proposals. Arch. Gen. Psychiatry 63(5), 484–489. [DOI] [PubMed] [Google Scholar]
- Kroenke K, Spitzer RL, Williams JB, 2003. The Patient Health Questionnaire-2: validity of a two-item depression screener. Med. Care 41(11), 1284–1292. [DOI] [PubMed] [Google Scholar]
- Lee CM, Neighbors C, Kilmer JR, Larimer ME, 2010. A brief, web-based personalized feedback selective intervention for college student marijuana use: a randomized clinical trial. Psychol. Addict. Behav 24(2), 265–273. [DOI] [PMC free article] [PubMed] [Google Scholar]
- Leon AC, Davis LL, Kraemer HC, 2011. The role and interpretation of pilot studies in clinical research. J. Psychiatr. Res 45(5), 626–629. [DOI] [PMC free article] [PubMed] [Google Scholar]
- Loflin MJ, Kiluk BD, Huestis MA, Aklin WM, Budney AJ, Carroll KM, D’Souza DC, Dworkin RH, Gray KM, Hasin DS, 2020. The state of clinical outcome assessments for cannabis use disorder clinical trials: A review and research agenda. Drug Alcohol Depend., 107993. [DOI] [PMC free article] [PubMed] [Google Scholar]
- Magill M, Barnett NP, Apodaca TR, Rohsenow DJ, Monti PM, 2009. The role of marijuana use in brief motivational intervention with young adult drinkers treated in an emergency department. J Stud Alcohol Drugs 70(3), 409–413. [DOI] [PMC free article] [PubMed] [Google Scholar]
- Mahamad S, Wadsworth E, Rynard V, Goodman S, Hammond D, 2020. Availability, retail price and potency of legal and illegal cannabis in Canada after recreational cannabis legalisation. Drug Alcohol Rev 39(4), 337–346. [DOI] [PubMed] [Google Scholar]
- Maier LJ, Ramo DE, Kaur M, Meacham MC, Satre DD, 2020. Factors associated with readiness to quit smoking among young adults enrolled in a Facebook-based tobacco and alcohol intervention study. Addict. Behav 111, 106524. [DOI] [PMC free article] [PubMed] [Google Scholar]
- Martin-Willett R, Helmuth T, Abraha M, Bryan AD, Hitchcock L, Lee K, Bidwell LC, 2020. Validation of a multisubstance online Timeline Followback assessment. Brain Behav 10(1), e01486. [DOI] [PMC free article] [PubMed] [Google Scholar]
- Martin-Willett R, McCormick Z, Newman W, Larsen LD, Ortiz Torres MA, Bidwell LC, 2019. The transformation of a gold standard in-person substance use assessment to a web-based, REDCap integrated data capture tool. J Biomed Inform 94, 103186. [DOI] [PMC free article] [PubMed] [Google Scholar]
- Matheson J, Le Foll B, 2020. Cannabis Legalization and Acute Harm From High Potency Cannabis Products: A Narrative Review and Recommendations for Public Health. Frontiers in psychiatry 11, 591979. [DOI] [PMC free article] [PubMed] [Google Scholar]
- Merchant RM, 2020. Evaluating the Potential Role of Social Media in Preventive Health Care. JAMA 323(5), 411–412. [DOI] [PubMed] [Google Scholar]
- Moreno MA, D’Angelo J, 2019. Social Media Intervention Design: Applying an Affordances Framework. J. Med. Internet Res 21(3), e11014. [DOI] [PMC free article] [PubMed] [Google Scholar]
- O’Connor E, Thomas R, Senger CA, Perdue L, Robalino S, Patnode C, 2020. Interventions to prevent illicit and nonmedical drug use in children, adolescents, and young adults: updated evidence report and systematic review for the US Preventive Services Task Force. JAMA 323(20), 2067–2079. [DOI] [PubMed] [Google Scholar]
- Onken LS, Carroll KM, Shoham V, Cuthbert BN, Riddle M, 2014. Reenvisioning clinical science unifying the discipline to improve the public health. Clin Psychol Sci. 2(1), 22–34. [DOI] [PMC free article] [PubMed] [Google Scholar]
- Pagoto SL, Baker K, Griffith J, Oleski JL, Palumbo A, Walkosz BJ, Hillhouse J, Henry KL, Buller DB, 2016. Engaging moms on teen indoor tanning through social media: Protocol of a randomized controlled trial. JMIR Res Protoc 5(4), e228. [DOI] [PMC free article] [PubMed] [Google Scholar]
- Palamar JJ, 2021. Increases in Frequent Vaping of Cannabis Among High School Seniors in the United States, 2018–2019. J. Adolesc. Health 69(1), 153–156. [DOI] [PMC free article] [PubMed] [Google Scholar]
- Pearson MR, Bravo AJ, Conner BT, 2017. Distinguishing subpopulations of marijuana users with latent profile analysis. Drug Alcohol Depend. 172, 1–8. [DOI] [PMC free article] [PubMed] [Google Scholar]
- Plummer F, Manea L, Trepel D, McMillan D, 2016. Screening for anxiety disorders with the GAD-7 and GAD-2: a systematic review and diagnostic metaanalysis. Gen. Hosp. Psychiatry 39, 24–31. [DOI] [PubMed] [Google Scholar]
- Ramo DE, Thrul J, Chavez K, Delucchi KL, Prochaska JJ, 2015. Feasibility and quit rates of the Tobacco Status Project: A Facebook smoking cessation intervention for young adults. J. Med. Internet Res 17(12), e291. [DOI] [PMC free article] [PubMed] [Google Scholar]
- Salas-Wright CP, Vaughn MG, Perron BE, Gonzalez JM, Goings TC, 2016. Changing perspectives on marijuana use during early adolescence and young adulthood: Evidence from a panel of cross-sectional surveys. Drug Alcohol Depend. 169, 5–10. [DOI] [PubMed] [Google Scholar]
- Schulenberg J, Johnston L, O’Malley P, Bachman J, Miech R, Patrick M, 2020. Monitoring the Future national survey results on drug use, 1975–2019: Volume II, college students and adults ages 19–60. [Google Scholar]
- Scott JC, Slomiak ST, Jones JD, Rosen AFG, Moore TM, Gur RC, 2018. Association of Cannabis With Cognitive Functioning in Adolescents and Young Adults: A Systematic Review and Meta-analysis. JAMA psychiatry 75(6), 585–595. [DOI] [PMC free article] [PubMed] [Google Scholar]
- Simons JS, Wills TA, Emery NN, Marks RM, 2015. Quantifying alcohol consumption: Self-report, transdermal assessment, and prediction of dependence symptoms. Addict. Behav 50, 205–212. [DOI] [PMC free article] [PubMed] [Google Scholar]
- Skapinakis P, 2007. The 2-item Generalized Anxiety Disorder scale had high sensitivity and specificity for detecting GAD in primary care. Evid. Based Med 12(5), 149. [DOI] [PubMed] [Google Scholar]
- Smart R, Caulkins JP, Kilmer B, Davenport S, Midgette G, 2017. Variation in cannabis potency and prices in a newly legal market: evidence from 30 million cannabis sales in Washington state. Addiction 112(12), 2167–2177. [DOI] [PMC free article] [PubMed] [Google Scholar]
- Somerville LH, 2016. Searching for Signatures of Brain Maturity: What Are We Searching For? Neuron 92(6), 1164–1167. [DOI] [PubMed] [Google Scholar]
- Standeven LR, Scialli A, Chisolm MS, Terplan M, 2020. Trends in Cannabis Treatment Admissions in Adolescents/Young Adults: Analysis of TEDS-A 1992 to 2016. J. Addict. Med 14(4), e29–e36. [DOI] [PubMed] [Google Scholar]
- Stoddard SA, Bauermeister JA, Gordon-Messer D, Johns M, Zimmerman MA, 2012. Permissive norms and young adults’ alcohol and marijuana use: the role of online communities. Journal of studies on alcohol and drugs 73(6), 968–975. [DOI] [PMC free article] [PubMed] [Google Scholar]
- Substance Abuse and Mental Health Service Administration, 2021. Results from the 2020 National Survey on Drug Use and Health: Detailed Tables. Rockville, MD: Center for Behavioral Statistics and Quality, Substance Abuse and Mental Health Services Administration. Retrieved from https://www.samhsa.gov/data/report/2020-nsduh-detailed-tables. [Google Scholar]
- Sun Y, Liu B, Wallace RB, Bao W, 2020. Association of Cannabis Use With All-Cause and Cause-Specific Mortality Among Younger- and Middle-Aged U.S. Adults. Am. J. Prev. Med 59(6), 873–879. [DOI] [PubMed] [Google Scholar]
- Teitcher JE, Bockting WO, Bauermeister JA, Hoefer CJ, Miner MH, Klitzman RL, 2015. Detecting, preventing, and responding to “fraudsters” in internet research: Ethics and tradeoffs. J. Law. Med. Ethics 43(1), 116–133. [DOI] [PMC free article] [PubMed] [Google Scholar]
- Thrul J, Klein AB, Ramo DE, 2015. Smoking cessation intervention on Facebook: Which content generates the best engagement? J. Med. Internet Res 17(11), e244. [DOI] [PMC free article] [PubMed] [Google Scholar]
- Topolovec-Vranic J, Natarajan K, 2016. The Use of Social Media in Recruitment for Medical Research Studies: A Scoping Review. J. Med. Internet Res 18(11), e286. [DOI] [PMC free article] [PubMed] [Google Scholar]
- Volkow ND, Baler RD, Compton WM, Weiss SR, 2014. Adverse health effects of marijuana use. N. Engl. J. Med 370(23), 2219–2227. [DOI] [PMC free article] [PubMed] [Google Scholar]
- Walker DD, Stephens RS, Blevins CE, Banes KE, Matthews L, Roffman RA, 2016. Augmenting brief interventions for adolescent marijuana users: The impact of motivational check-ins. J. Consult. Clin. Psychol 84(11), 983–992. [DOI] [PMC free article] [PubMed] [Google Scholar]
- Woolard R, Baird J, Longabaugh R, Nirenberg T, Lee CS, Mello MJ, Becker B, 2013. Project reduce: Reducing alcohol and marijuana misuse: Effects of a brief intervention in the emergency department. Addict. Behav 38(3), 1732–1739. [DOI] [PMC free article] [PubMed] [Google Scholar]
- Young SD, Cumberland WG, Nianogo R, Menacho LA, Galea JT, Coates T, 2015. The HOPE social media intervention for global HIV prevention in Peru: A cluster randomised controlled trial. Lancet HIV 2(1), e27–32. [DOI] [PMC free article] [PubMed] [Google Scholar]
- Young SD, Koussa M, Lee SJ, Perez H, Gill N, Gelberg L, Heinzerling K, 2018. Feasibility of a social media/online community support group intervention among chronic pain patients on opioid therapy. J. Addict. Dis 37(1–2), 96–101. [DOI] [PMC free article] [PubMed] [Google Scholar]
- Yurasek AM, Dennhardt AA, Murphy JG, 2015. A randomized controlled trial of a behavioral economic intervention for alcohol and marijuana use. Exp. Clin. Psychopharmacol 23(5), 332–338. [DOI] [PMC free article] [PubMed] [Google Scholar]
- Zlotorzynska M, Bauermeister JA, Golinkoff JM, Lin W, Sanchez TH, Hightow-Weidman L, 2021. Online recruitment of youth for mHealth studies. Mhealth 7, 27. [DOI] [PMC free article] [PubMed] [Google Scholar]