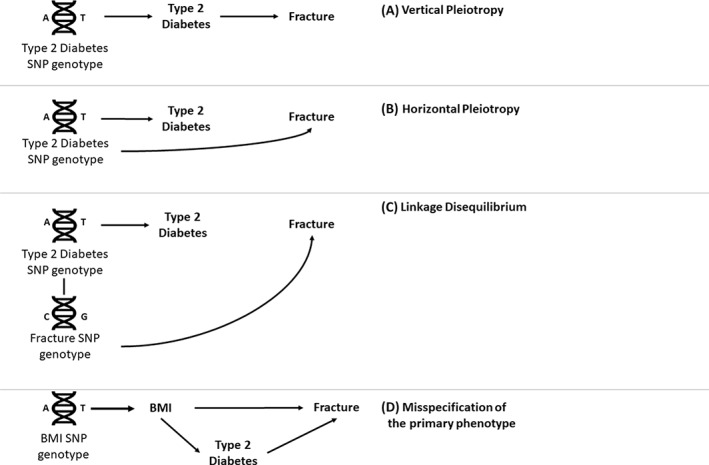
Fig. 2.

Directed acyclic graph highlighting vertical versus horizontal pleiotropy. (A) Vertical pleiotropy is where the instrument is only associated with the outcome (fracture) via the exposure (type 2 diabetes). This is a key requirement of Mendelian randomization (MR) and does not lead to biased effect estimates (except in the case of misspecifying the primary phenotype outlined below). (B) Horizontal pleiotropy is where the instrument is associated with the outcome via a pathway independent of the exposure. This will lead to bias in the effect estimate for type 2 diabetes on fracture. (C) Where the instrument is in close proximity to a single‐nucleotide polymorphism (SNP) strongly associated with the outcome, the genotypes at these two loci can be correlated due to linkage disequilibrium (LD). This will cause the same bias as horizontal pleiotropy in an MR study. It is important to note that although SNPs are often selected based on the lowest p value in a region, they are not necessarily causal for the exposure but are in LD with a disease‐causing variant. (D) Misspecification of the primary phenotype can cause bias in an MR analysis. This occurs when genetic variants associated with a phenotype upstream of the exposure are identified in the genomewide association study (GWAS) of the exposure due to a large sample size and thus well‐powered GWAS. For example, in an MR of type 2 diabetes on fracture, a positive effect of type 2 diabetes may be observed due to the inclusion of body mass index (BMI) SNPs as instruments for type 2 diabetes.
