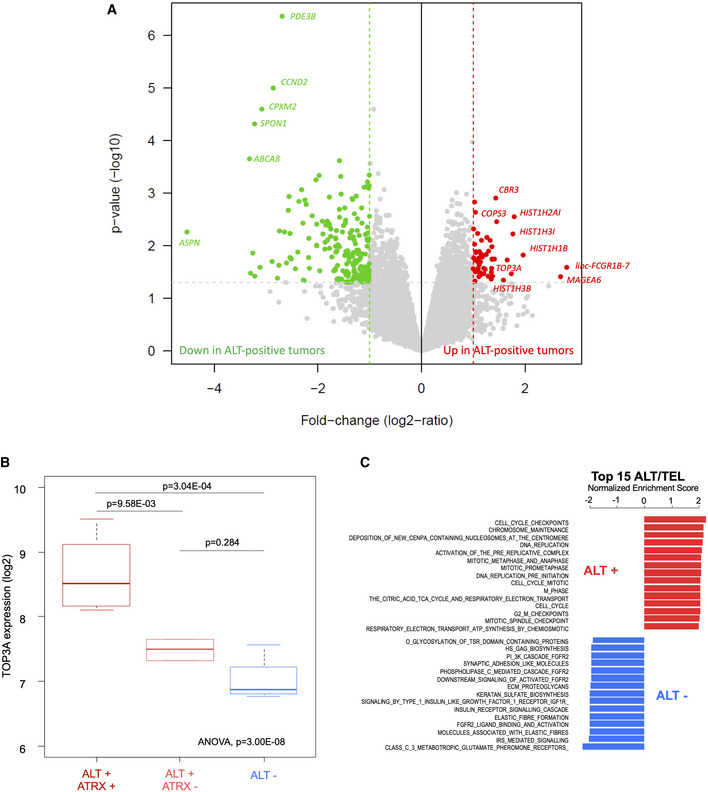
Figure 4. TOP3A is overexpressed in alternative lengthening of telomeres (ALT)‐positive/α‐thalassemia/mental retardation syndrome X‐linked wild‐type (ATRX‐wt) osteosarcomas.

- Volcano plot of the supervised analysis of mRNA expression profiles of osteosarcomas according to ALT‐positive vs. ALT‐negative samples, showing upregulated (in red) and downregulated (in green) genes. In all, 12 tumors had sufficient RNA quality to be analyzed: seven ALT‐positive ATRX‐wt, two ALT‐positive/ATRX‐mutated and three ALT‐negative.
- TOP3A gene expression according to ALT and ATRX status: ALT+/ATRX‐wt (n = 7), ALT+/ATRX‐mut (n = 2) and ALT− (n = 3). Box‐and‐whisker plot was defined with default parameters by median value (central band at the 50th percentile), interquartile ranges (IQR, box limited by 25th and 75th percentiles) and whisker boundaries defined by minimum and maximum value. An ANOVA statistical test and Tukey's range test were used to compare modalities.
- Normalized enrichment score bar plot of top 15 significant REACTOME gene sets according to ALT‐positive vs. ALT‐negative GSEA analysis. Ontologies associated with ALT positivity are in red and those associated with ALT negativity are in blue.
