
Figure EV5. Effect of ectopic ATRX expression.
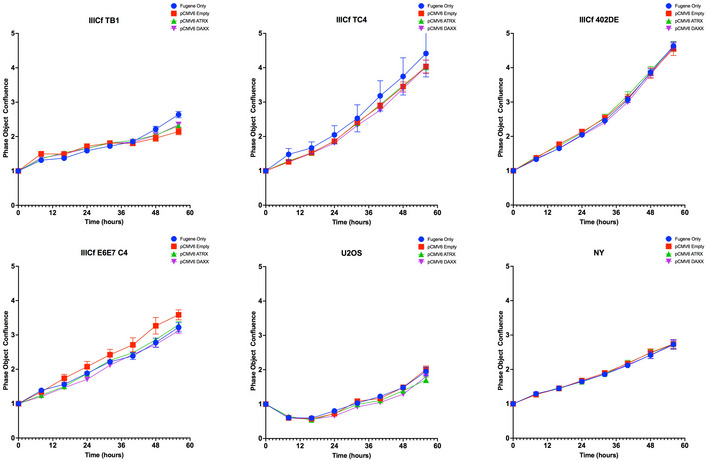
Growth curve (Points and error bars (±SEM) represent extrapolation of phase‐contrast object confluence assessed by Incucyte optical system from n = 3 technical replicates) according to transfection condition (FuGENE only, pCMV6‐empty, −ATRX, ‐DAXX).