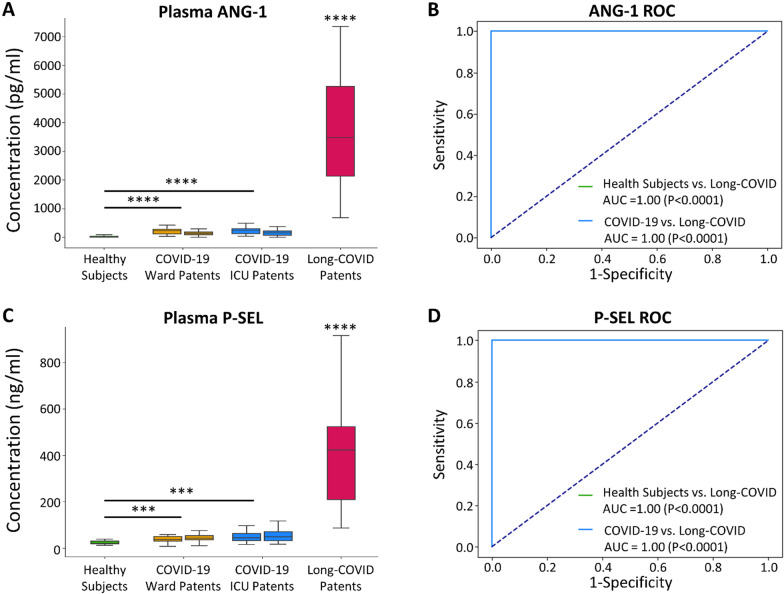
Fig. 3.
Box plots and receiver operating characteristic (ROC) curves for leading biomarkers, ANG-1 and P-SEL. A A boxplot demonstrating significantly elevated blood ANG-1 concentrations in Long-COVID outpatients (****P < 0.0001). B ROC curves demonstrating the excellent Long-COVID classification potential of blood ANG-1 versus healthy control subjects (AUC = 1.00, P < 0.0001) and acutely ill COVID-19 inpatients (AUC = 1.00, P < 0.0001). ROC curve for Long-COVID versus healthy control (green) hidden by ROC curve for Long-COVID versus acutely ill COVID-19 patients. C A boxplot demonstrating significantly elevated blood P-SEL concentrations in Long-COVID outpatients (****P < 0.0001; ***P < 0.001). D ROC curves demonstrating the excellent Long-COVID classification potential of blood P-SEL versus healthy control subjects (AUC = 1.00, P < 0.0001) and acutely ill COVID-19 inpatients (AUC = 1.00, P < 0.0001). ROC curve for Long-COVID versus healthy control (green) hidden by ROC curve for Long-COVID versus acutely ill COVID-19 patients

