Figure 8.
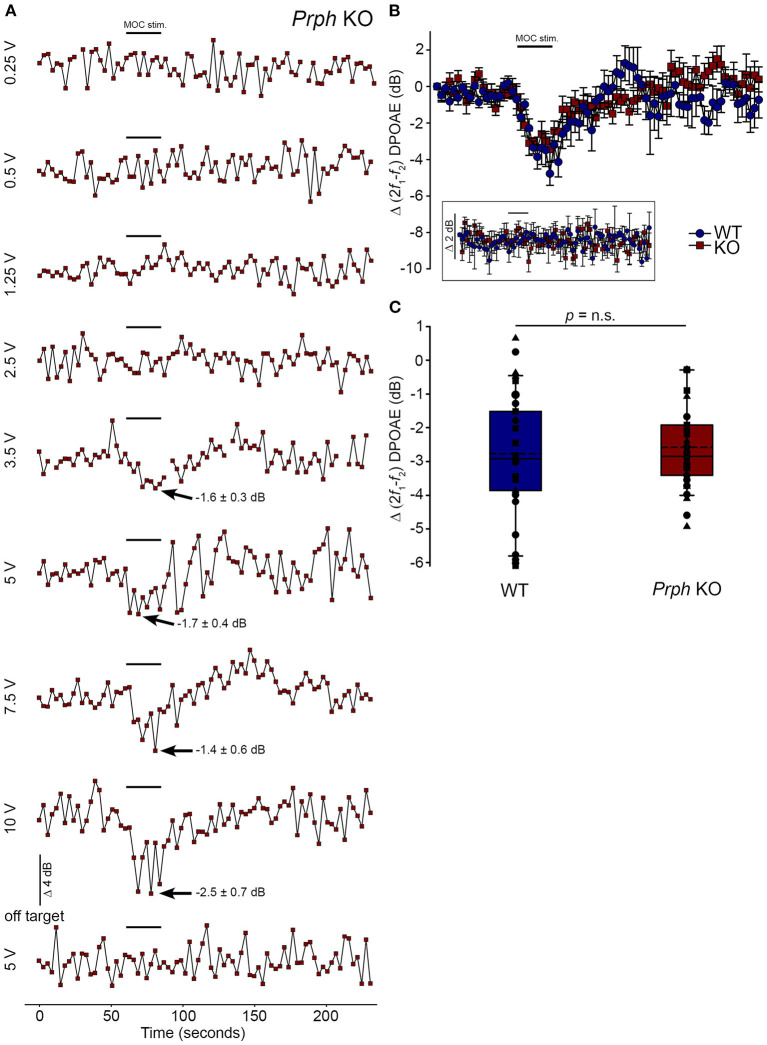
Equivalency of electrically-evoked DPOAE suppression in PrphKO and wildtype (WT) mice under isoflurane anesthesia. (A) Baseline cubic DPOAE (2f1-f2) with f1 and f2 primaries around 16 kHz at 50–55 dB SPL was established using 3 s repeated sampling for 60 s, followed by 25 s of direct electrical stimulation of the crossed olivocochlear bundle fibers on the floor of the brainstem fourth ventricle (medial olivocochlear efferent stimulation (MOC stim.), black bar; monophasic pulses, 150 μs duration, 200 Hz), and then 150 s of recovery (PrphKO mouse). The bottom trace (“off-target”) illustrates a “false-negative” outcome (a 2 mm rostral repositioning of the probe eliminated the suppression of DPOAE elicited with an equivalent 5 V stimulus level). Arrows indicate average contralateral suppression over the stimulus period relative to the preceding baseline average. (B) Overlay of the averaged electrically-evoked DPOAE suppression responses for WT and KO mice. The data show the mean and S.E.M. based on 3–5 repeated MOC stimuli for each mouse, with 25 s electrical stimulation at suprathreshold stimulus voltages (WT 5V, n = 3; KO 2–8 V, n = 3). The inset shows stability of the recordings with subthreshold stimulation (0.25–1V). (C) Boxplots show the equivalency of the average electrically-evoked DPOAE suppressions, with 25 and 75% boundaries and bars to 95% confidence limits. Individual data overlaid (symbols show repeats for individual mice); dashed lines show the mean; solid lines show the median. p = n.s. indicates p > 0.05, by repeated measure two-way ANOVA.

