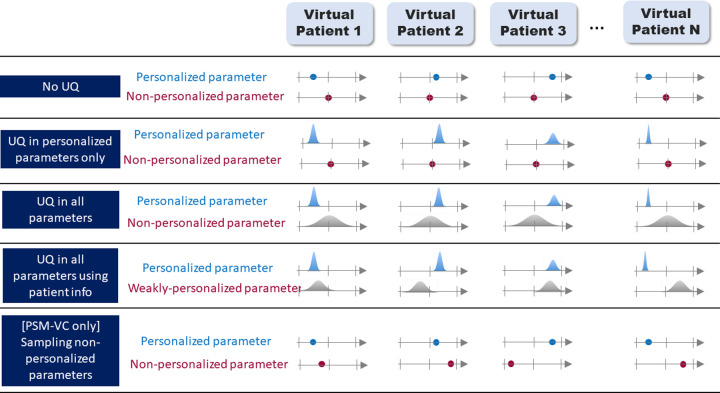
Fig 2. Five example UQ paradigms in patient-specific modeling.
The N virtual patients could be N members of a virtual cohort in PSM-VC, or N new patients for a PSM-CT. In the first row, there is no UQ; the personalized parameter varies across the subjects, the non-personalized parameter is constant. In the second row, uncertainty in the personalized parameter (e.g., due to measurement error) is accounted for–represented here as a probability distribution, though other methods for accounting for uncertainty could be used. In the third row, uncertainty in the non-personalized parameter (e.g., due to population variability) is also accounted for. In the fourth row, some patient information is used to constrain the distributions for the ‘non-personalized’ parameters (e.g., if the parameter is known to differ between sexes). In the final row (PSM-VC only) the non-personalized parameter is randomly sampled in the cohort members, rather than taking the population average value for all patients. Other options are possible.

