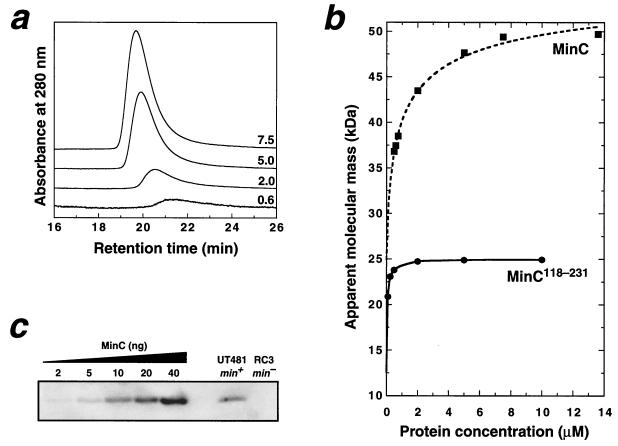
FIG. 2.
Dimerization of MinC is mediated by the C-terminal domain. (a) A series of chromatograms resulting from application of different loading concentrations of MinC onto a Superdex 75 gel filtration column (APB). Each chromatogram is labeled with the MinC micromolar loading concentration; the vertical scale of the 0.6 μM data has been multiplied by a factor of 4 for clarity. The elution buffer was 10 mM Tris–50 mM NaCl–1 mM Tris(2-carboxyethyl)phosphine–0.02% NaN3 (pH 8.0), and the flow rate was 0.5 ml min−1. Note the increase in retention time as the protein concentration is reduced. (b) Apparent molecular mass of MinC and MinC118–231 on a Superdex 75 column as a function of protein concentration. The MinC data was fitted (dashed line) by using KaleidaGraph (version 3.04) as described previously (14) to yield a Kd value of 0.5 ± 0.2 μM and apparent monomer and dimer masses of 24.9 ± 0.5 and 57.1 ± 0.8 kDa, respectively. The solid curve is a simple interpolated fit to the MinC118–231 data. (c) Immunoblot of whole-cell extracts of wild-type E. coli UT481 and the isogenic ΔminCDE strain RC3. Note the absence of immunoreactive MinC in the RC3 extract. Recombinant MinC standards run on the same gel (lanes 1 to 5) gave a linear standard curve over the range of 2 to 40 ng of MinC/lane. In order to avoid potential underestimation of the MinC concentration due to limited protein binding capacity of the membranes, the standards were diluted in RC3 extract. Immunoblots were developed by using a chemifluorescent substrate (4) and were quantitated on a Storm 860 Fluorimager (Molecular Dynamics) using ImageQuant software (version 5.0).

