
Figure 1. Angiogenesis in the periventricular region of the germinal matrix in the prenatal human brain.
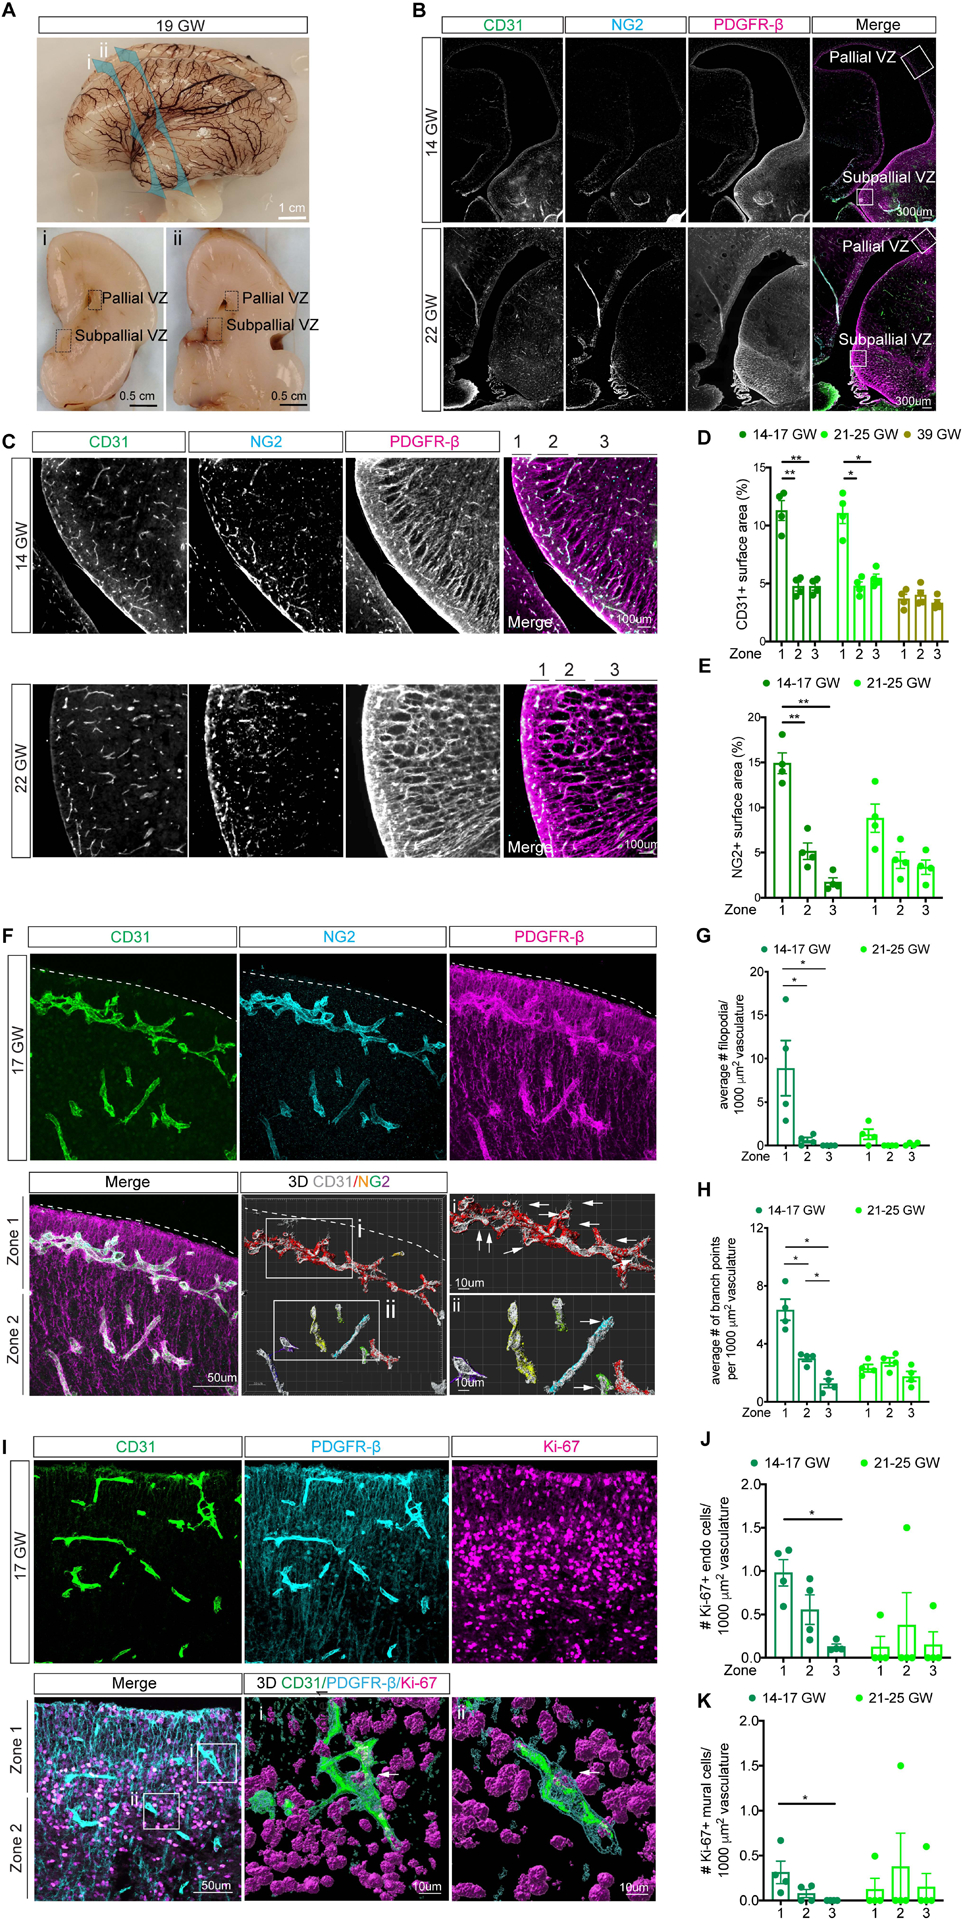
A. Gross photos of 19 GW prenatal human brain. Top: Lateral view showing the coronal planes for the bottom panels.
B. Confocal images of the periventricular area of human brain at 14 and 22 GW.
C. Immunostaining of CD31, NG2 and PDGFR-β in representative sections of the human medial ganglionic eminence (MGE) at 14 and 22 GW.
D-E. Quantification of CD31+ and NG2+ surface area in MGE.
F. Confocal image of 17 GW MGE immunostained for CD31, NG2 and PDGFR-β. 3D Imaris rendering shows CD31 (gray) and NG2 immunostaining with a gradient. Red indicates the highest NG2 expression to the lowest level in purple. The areas in the white box highlight filopodia (arrows).
G-H. Quantification of the number of filopodia (G) or branch points (H) in MGE.
I. Confocal image of the 17 GW MGE immunostained for CD31, Ki-67 and PDGFR-β. 3D images show Ki-67+ endothelial cell in i and Ki-67+ mural cell in ii.
J-K. Quantification of Ki-67+ endothelial (J) or mural (K) cells in MGE.
In D, E, G, H, J, and K, each data point represents the average of 5 sections from one case. Statistics used ANOVAs with post-hoc Student’s t-tests to assess differences within groups. Data are mean ± S.E.M. Non-significant comparisons not shown.