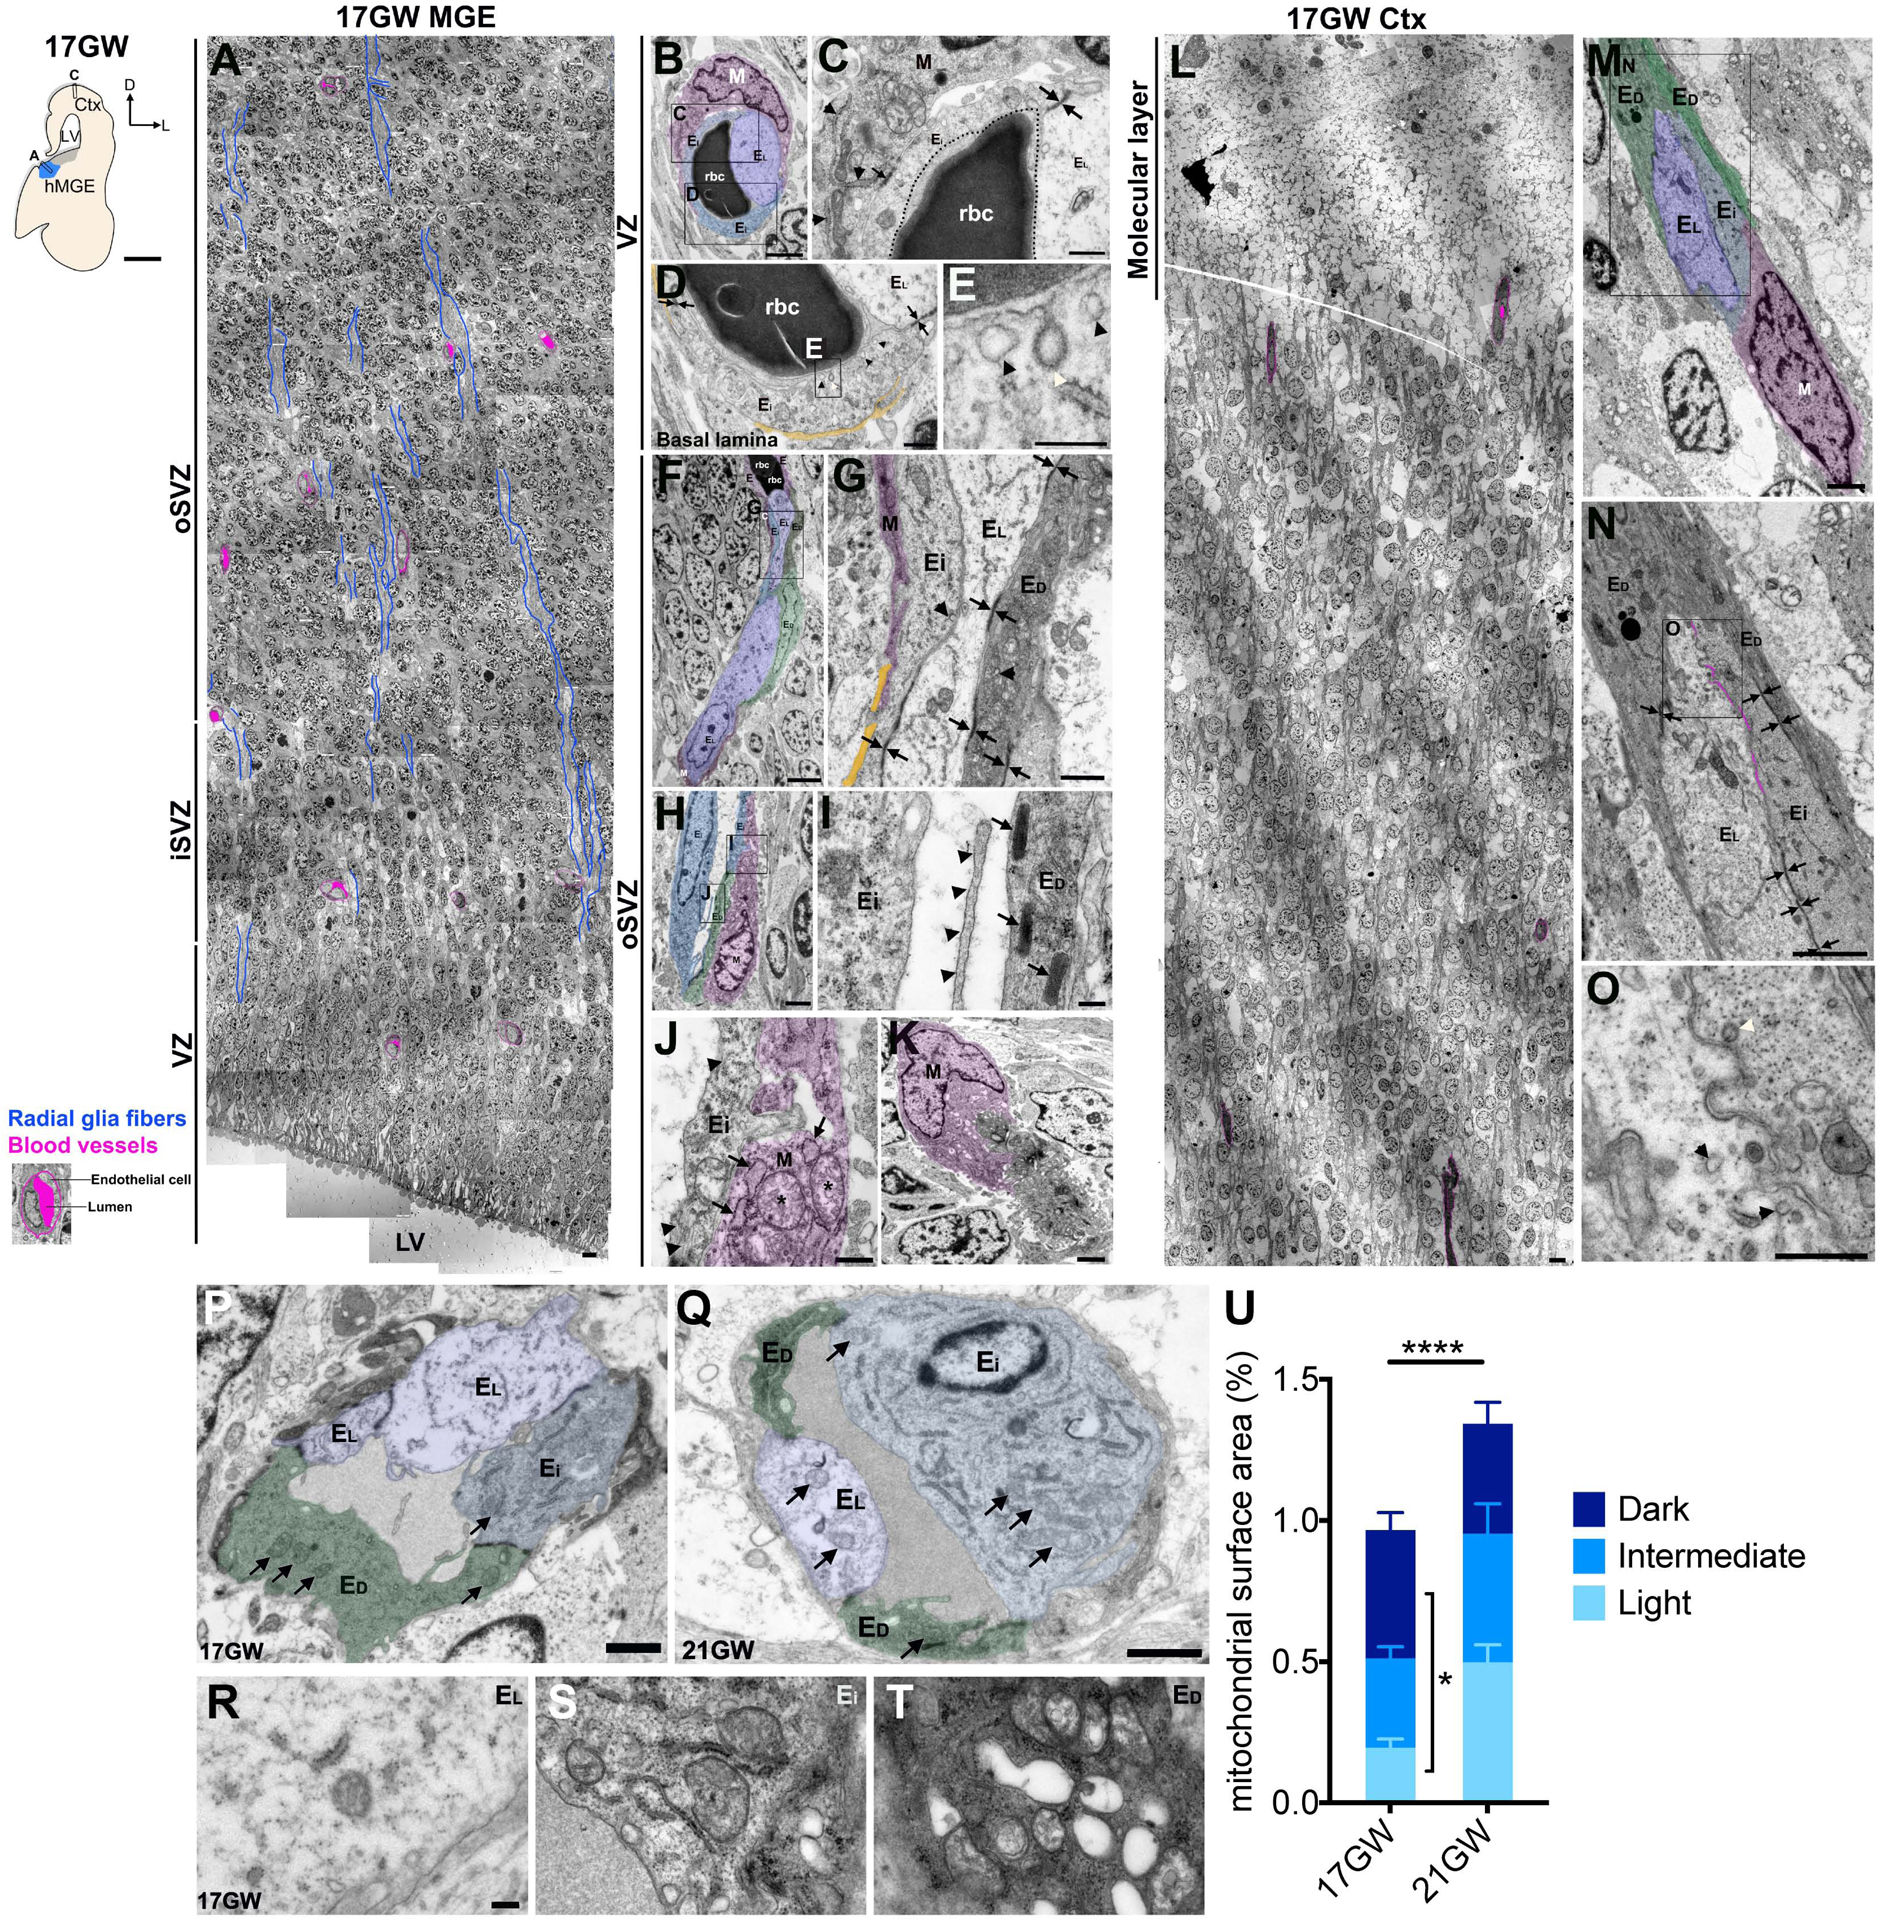
Figure 2. Ultrastructural features of developing human MGE and cortical vasculature.

A. Composite images of ultrathin sections from 17 GW MGE. The magenta outlines the vasculature, the dense magenta spots highlight the lumen of each blood vessel, and blue shows radial glial fibers.
B-E. Blood vessel in the VZ composed of intermediate (blue) and light (purple) endothelial cells and a mural cell (magenta).
C. High magnification of cells in B showing the mural cell cytoplasm with abundant RER (arrowheads) and adherens junctions (arrow). Intermediate and light endothelial cells show tight junctions (arrows). A dotted black line indicates the blood vessel lumen.
D. Tight junctions (arrows) between endothelial cells and discontinuous basal lamina (yellow).
E. High magnification from B highlighting the caveolae (black arrowheads) and clathrin coated vesicles (white arrowhead).
F-G. Blood vessel in the oSVZ showing light (EL), intermediate (Ei) and dark (ED) endothelial cells and mural cell expansions (M, magenta). Note the long tight junctions (arrows) and discontinuous basal lamina (yellow).
H-I. A blood vessel composed of intermediate (blue) and dark (green) endothelial cells and a mural cell (magenta).
I. High magnification of endothelial cells showing intraluminal filopodia (arrowheads) and Weibel-Palade bodies (arrows).
J. High magnification of an intermediate endothelial cell showing microtubules (arrowheads) and mural cell with its characteristic dilated RER (arrows) and abundant mitochondria (asterisk).
K. Mural cell (magenta) interdigitated with endothelial cells.
L. Composite images of ultrathin sections from the 17 GW cortex showing vascular distribution (magenta).
M-O Cortical blood vessels with dark (ED, green), intermediate (Ei, blue), and light (EL, purple) endothelial cells and a mural cell (magenta).
N. Higher magnification from M showing the junctional complexes between different types of endothelial cells (arrows) and the near obliterated vascular lumen (magenta line).
O. High magnification from N showing clathrin-coated vesicles (white arrowhead) and caveolae (black arrowhead) at the thin luminal surface.
P-Q. Blood vessels from the VZ at 17 GW (P) and 21 GW (Q) highlighting all 3 subtypes of endothelial cells and their mitochondria (arrows).
R-T. Higher magnification images to show the mitochondria and RER in each endothelial subtype (Light, R; Intermediate, S; Dark, T) at 17GW.
U. Quantification of mitochondrial surface area of each endothelial cell subtype at 17 and 21GW. Scale bars: A, L (5 μm); M, N: (2 μm); P, Q (1 μm); R-T (200 nm).
In U, each data point represents a blood vessel cell of the dark, intermediate, or light subtype from the 17 or 21 GW case. Statistics used ANOVA with post-hoc Student’s t-tests to assess differences within groups. Data are mean ± S.E.M.. Non-significant comparisons not shown.
