
Figure 3. Single-cell transcriptomics of endothelial and mural cells from prenatal human brain in the second trimester.
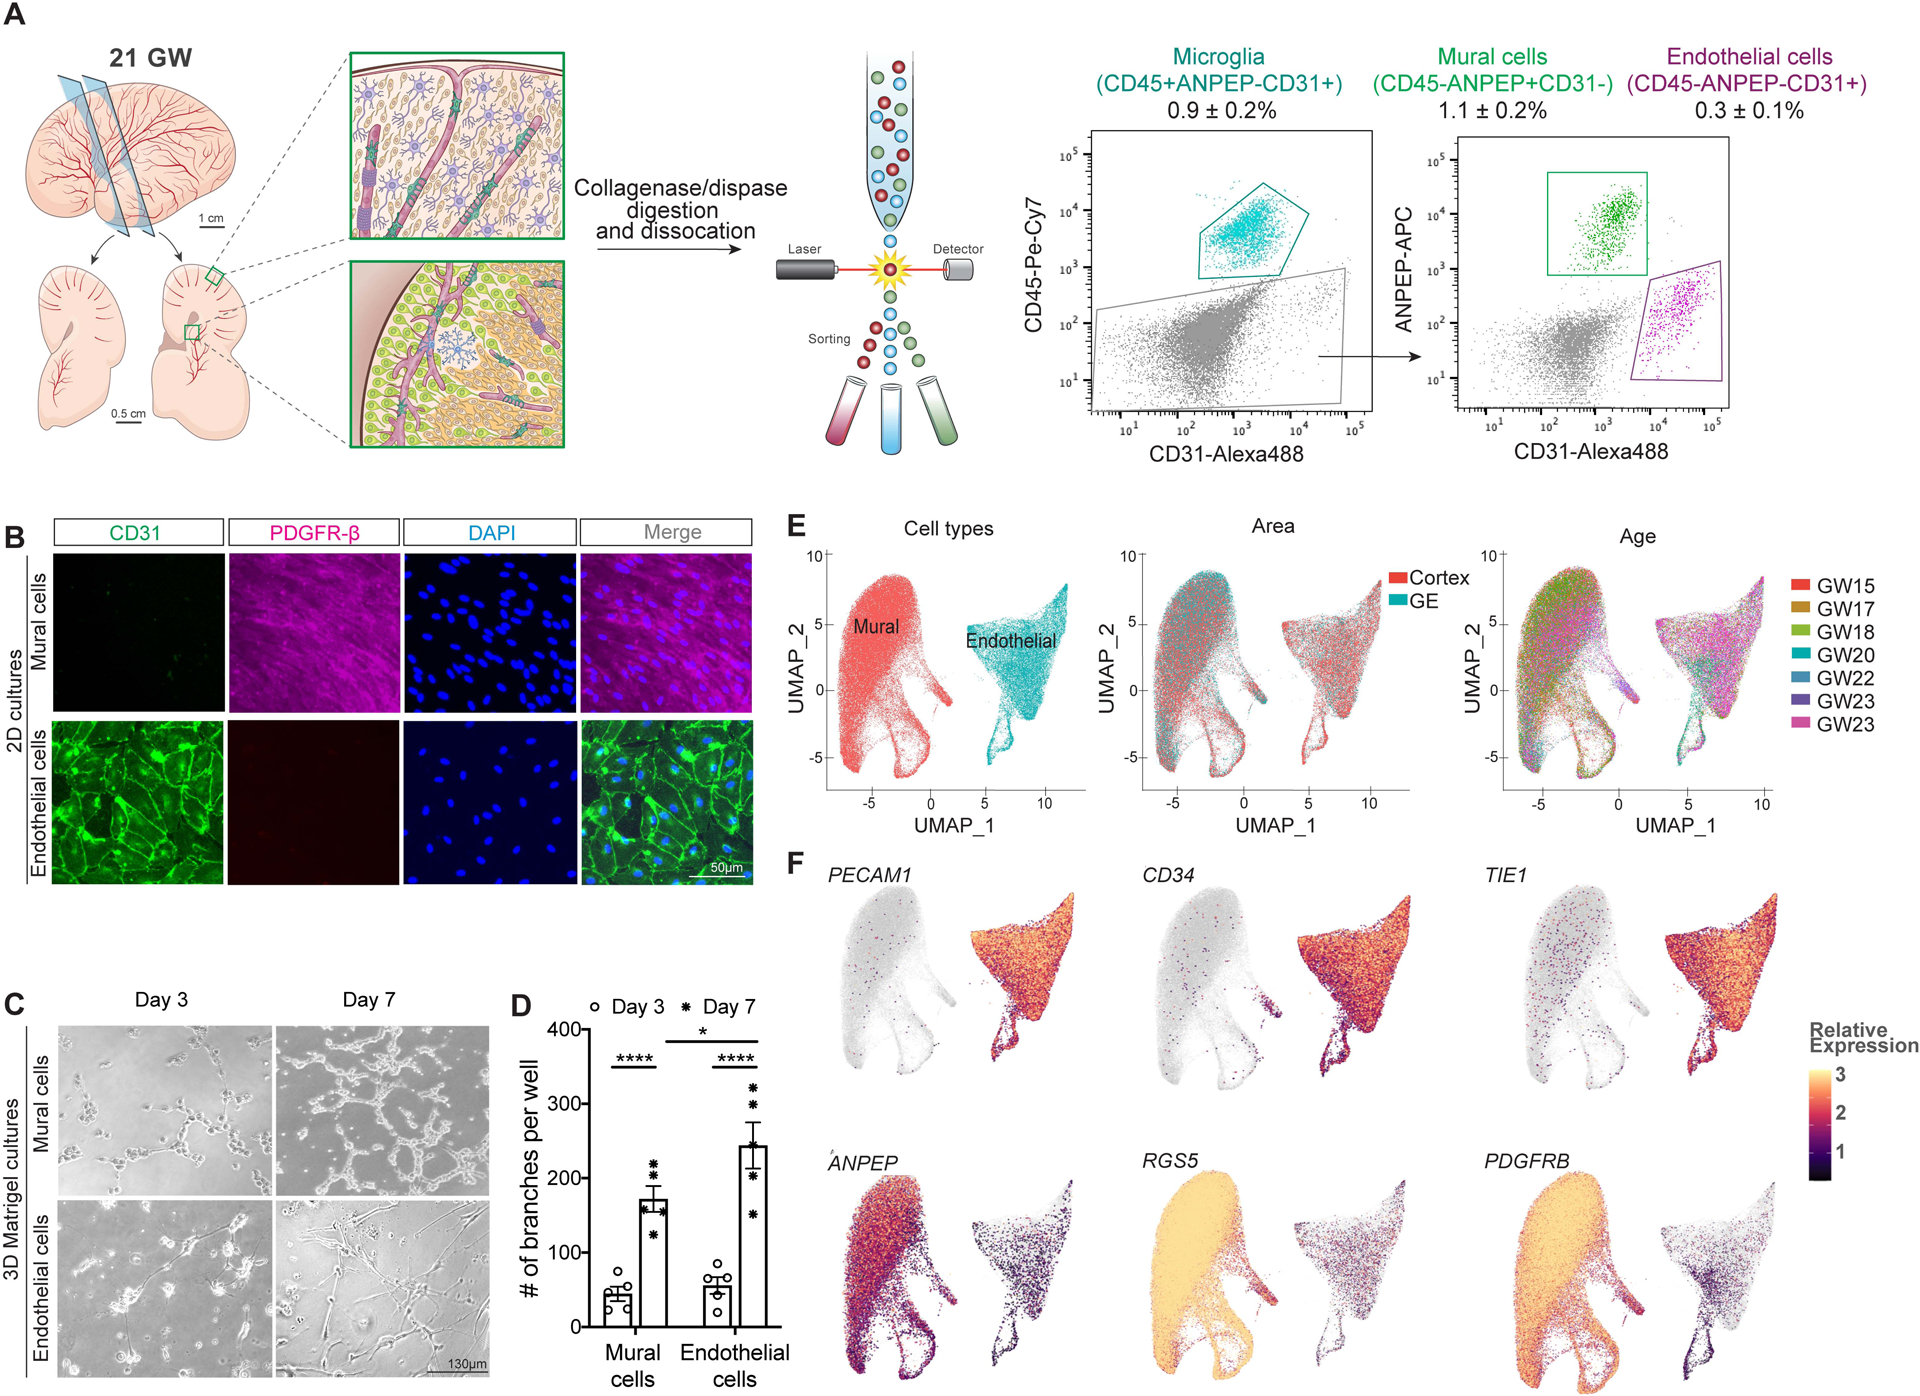
A schematic diagram for isolating endothelial and mural cells from the prenatal human brain. Left: Coronal sections of 21 GW prenatal human brain and higher power views depicting the cortex and GE and brief dissociation details. Right: Scattered dot plots showing the exclusion of CD45+ myeloid cells and selection of endothelial and mural cells.
B. Immunofluorescent images of CD31+ endothelial and PDGFR-β+ mural cells in 2D cultures in EGM-2 media.
C-D. Images of 3D Matrigel cultures of endothelial and mural cells showing their ability to form tubes (C). Quantification of the number of branch points established by endothelial and mural cells in 3D cultures (D). Each data point represents one well of cells from one case. Statistics used ANOVAs with post-hoc Student’s t-tests to assess differences within groups. Data are mean ± S.E.M. Non-significant comparisons not shown.
E. UMAP plots showing the clustering of endothelial and mural cells based on their subtypes, brain regions, and gestational ages.
F. Feature plots on the UMAP space showing the expression of pan-endothelial cell markers (PECAM1, CD34, and TIE1) and mural cell markers (ANPEP, RGS5, and PDGFRB) in each cluster.