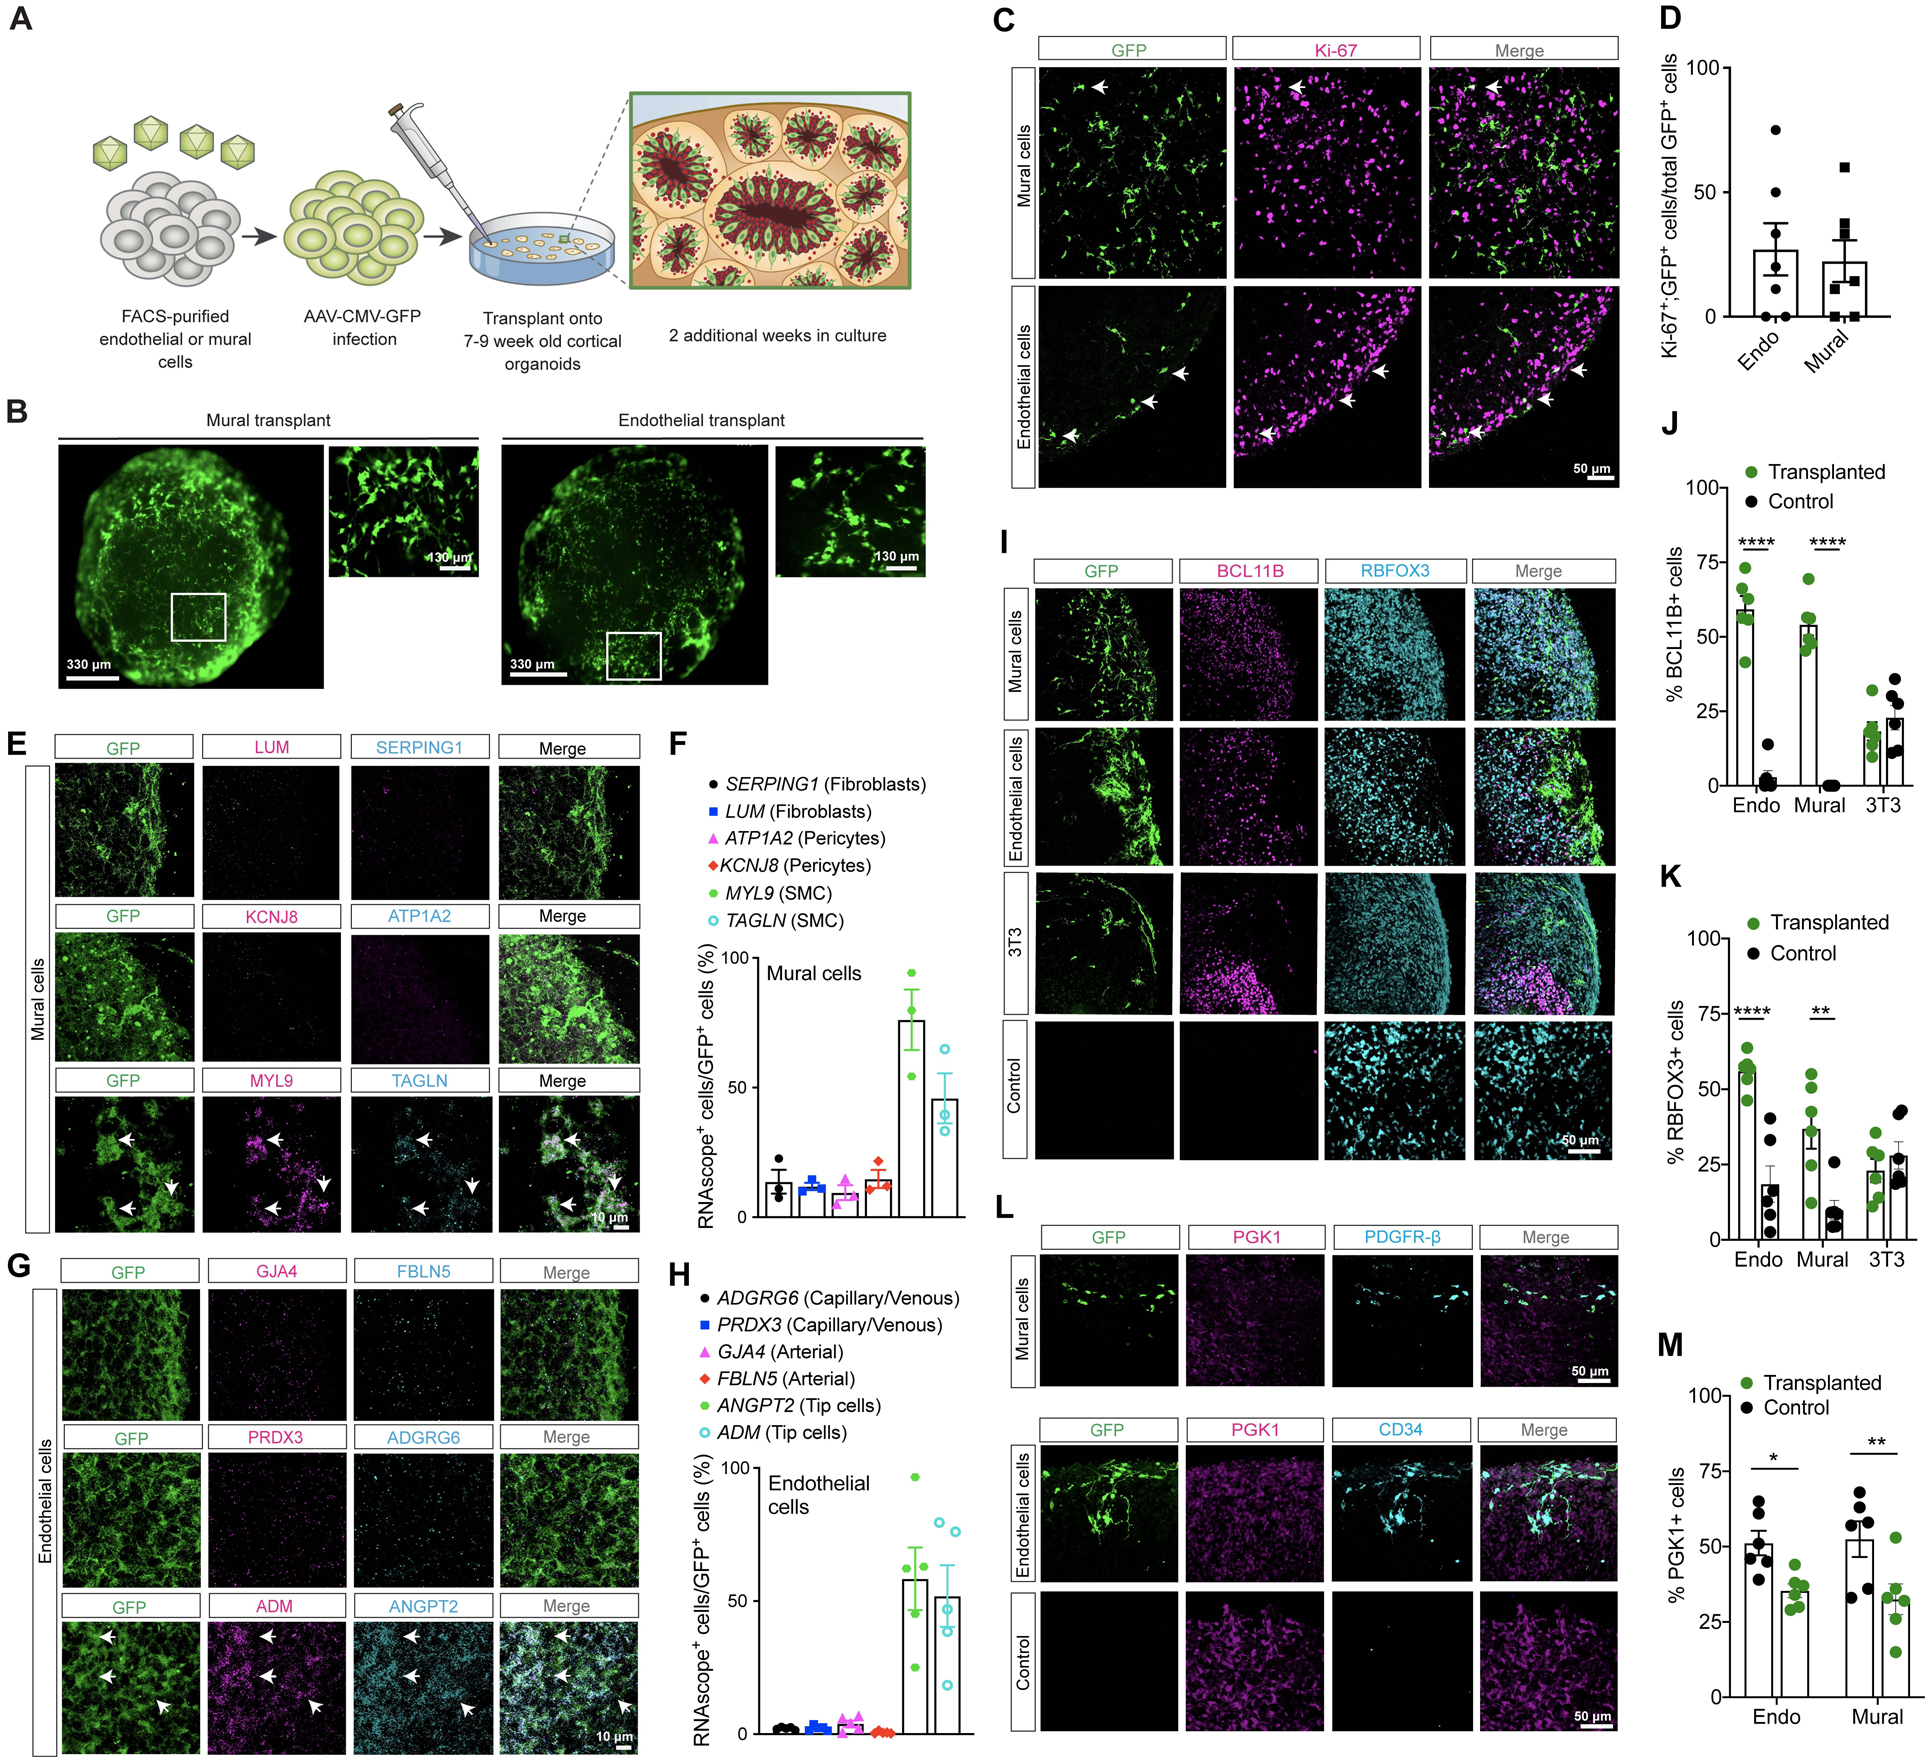
Figure 7. Human endothelial and mural cells promote neurogenesis and reduce cell stress in cortical organoids.

A. Schematic diagram for transplanting AAV-GFP labeled endothelial or mural cells into cortical organoids.
B. Microscopic images of transplanted endothelial and mural cell organoids after 7 days in culture.
C. Confocal images for immunostains for GFP and Ki-67 in the transplanted organoids.
D. Quantification of Ki-67+ cells in transplanted organoids.
E. Confocal images showing LUM, SERPING1, KCNJ8, ATP1A2, MYL9 and TAGLN RNA in transplanted mural cells.
F. Graph showing the subtype of transplanted mural cells in the cortical organoids as determined by RNAscope probes.
G. Confocal images of PRDX3, ADGRG6, GJA4, FBLN5, ANGPT2, and ADM RNA in transplanted endothelial cells.
H. Graph showing the subtype of transplanted endothelial cells in the cortical organoids as determined by RNAscope probes.
I. Confocal images for GFP, BCL11B (CTIP2), and RBFOX3 (NeuN) in the transplanted organoids.
J-K. Quantification of RBFOX3+ or BCL11B+ cells in organoids in GFP+ or control regions.
L. Confocal images for GFP, PGK1, and CD34 (endothelial cells) or PDGFR-β (mural cells) in organoids.
M. Quantification of PGK1+ cells in the organoids in GFP+ or control regions.
In D, J, K, and M, each data point represents the average of 5 sections from one transplant. Statistics used Student’s t-tests. Data are mean ± S.E.M.. Non-significant comparisons not shown.
