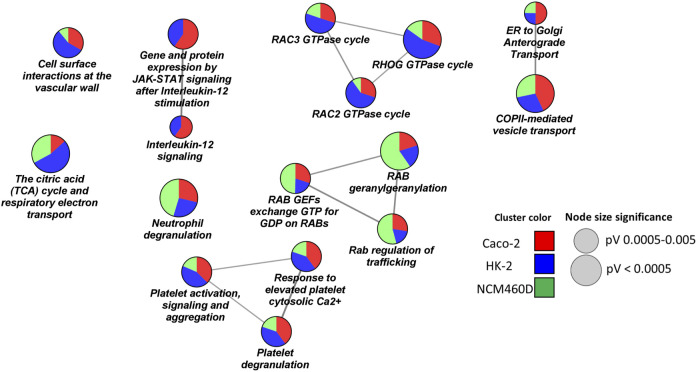
FIGURE 5.
Pathways enrichment analysis by ClueGO based on Reactome database. Networks representation of the enriched pathways in each cell line. The terms enriched in HK-2, NCM460D, and Caco-2 are represented as blue, green, and red pie slices, respectively. The slice extent represents the contribution of the specific dataset to the term. The node sizes are proportional to the FDR values.

