Fig. 6.

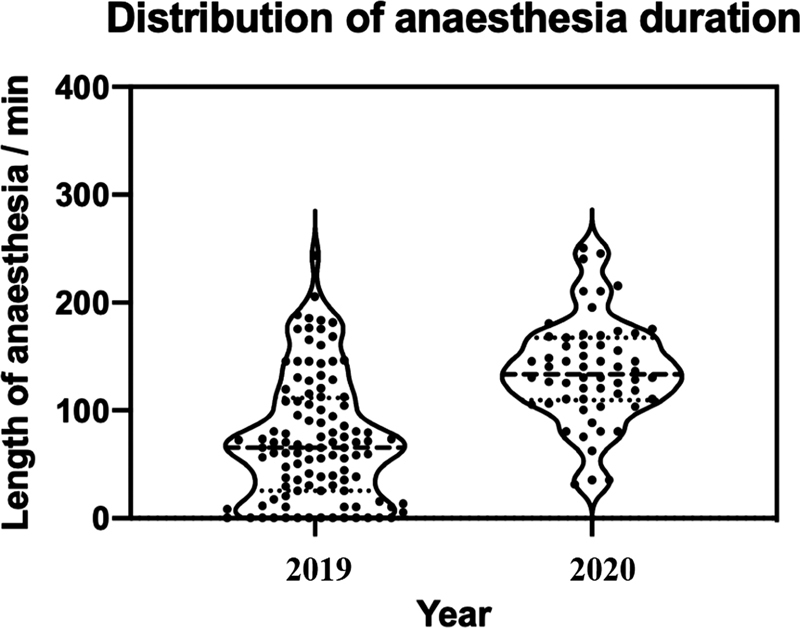
Violin plot showing the distribution of anesthesia length in 2019 and 2020. Data was adjusted to remove kernel density estimation below 0 minutes. The solid line represents the median, and the dashed represent the first and third quartiles.

Violin plot showing the distribution of anesthesia length in 2019 and 2020. Data was adjusted to remove kernel density estimation below 0 minutes. The solid line represents the median, and the dashed represent the first and third quartiles.