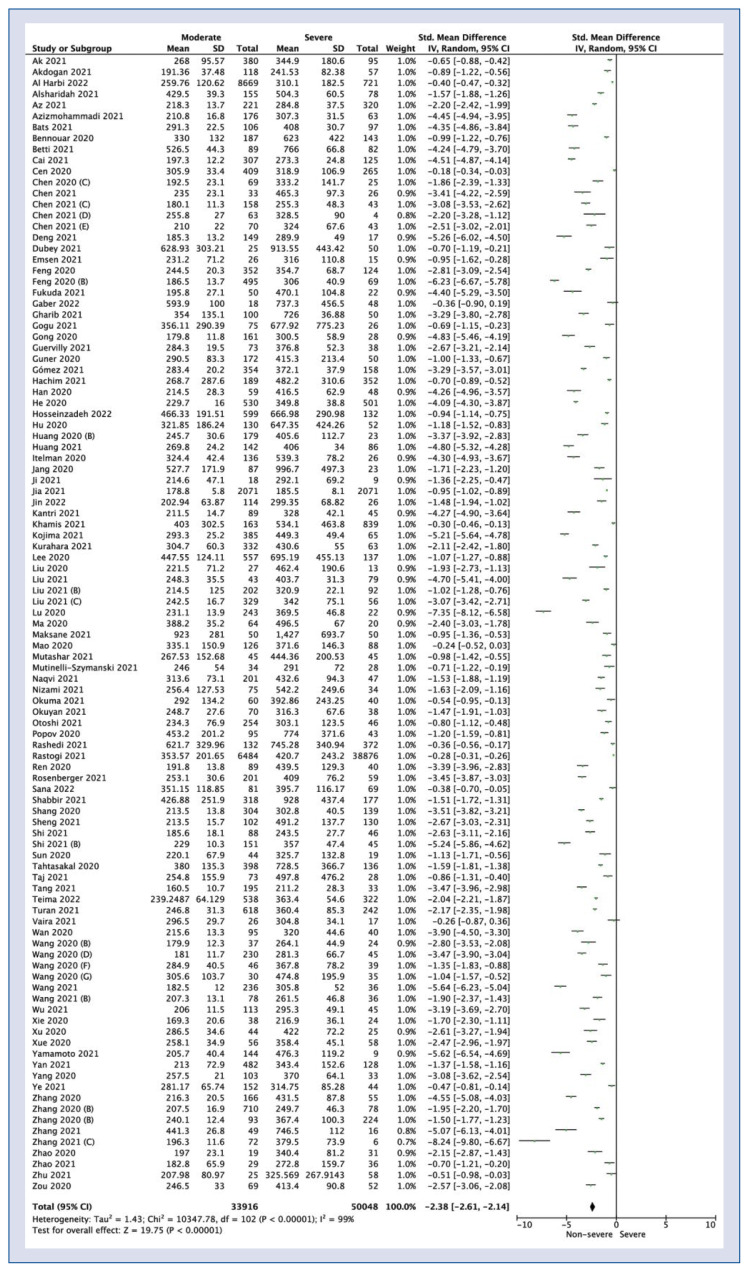
Figure 3.
Forest plot of lactate dehydrogenase levels among moderate vs. severe COVID-19 groups. The center of each square represents the weighted standard mean differences for individual trials, and the corresponding horizonal line stands for a 95% confidence interval (CI). The diamonds represent pooled results; SD — standard deviation.

