
Figure 2.
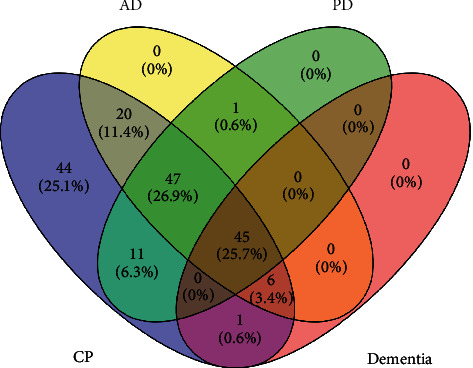
Network analysis. (a) Overlapping target genes among CP compounds, AD, PD, and dementia. (b) Compound-target-disease (C-T-D) network shows the interaction among CP compounds, targets, and dementia disorders. Hexagonal nodes represent CP compounds, whereas oval nodes represent their targets. Node size is proportional to its degree. The nodes of the first tier represent the targets with a higher degree of interaction with the compound.