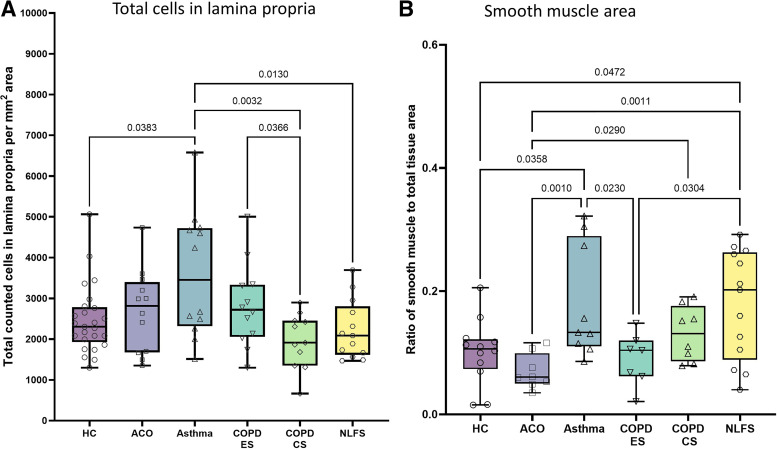
Figure 5.
Box plots showing the ANOVA results for lamina propria (LP) total cells/mm2 (A) and smooth muscle area (B) in healthy control (HC), patients with asthma COPD overlap (ACO), asthma, COPD exsmokers (COPD-ES), COPD current smokers (COPD-CS), and normal lung function smokers (NLFS). The box-and-whisker plots showing the minimum and the maximum value, the lower and the upper quartile and the horizontal line as median. P < 0.05 is significantly different. Insignificant P values are not shown in the plot. COPD, chronic obstructive pulmonary disease.

