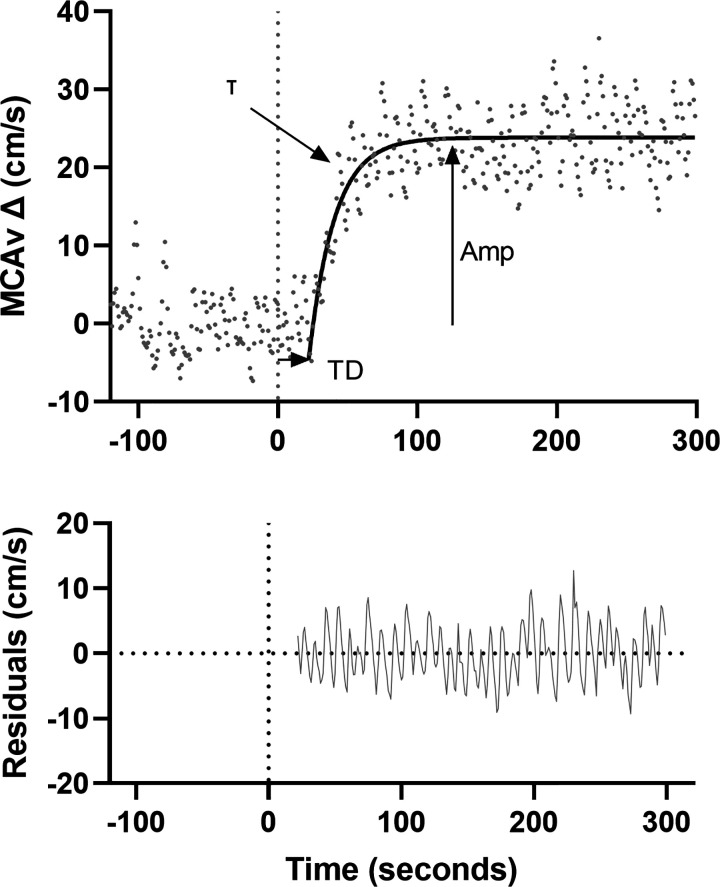
Figure 1.
An example of MCAv trace for one participant at rest (120 s) and following onset of hypercapnia (time 0, denoted by dotted line). Residual plot is included below. Hypercapnic response characterized by a monoexponential model with a delay term shown by the solid black line. Time delay (TD) presents the time from the start of hypercapnia (0 s) to the onset of the exponential rise. Time constant (τ) presents the time taken to reach 63% of the response amplitude and it reflects the rate of increase in MCAv. Amplitude (Amp) presents the change from baseline to the peak of the exponential increase in MCAv. MCAv, middle cerebral artery velocity.

