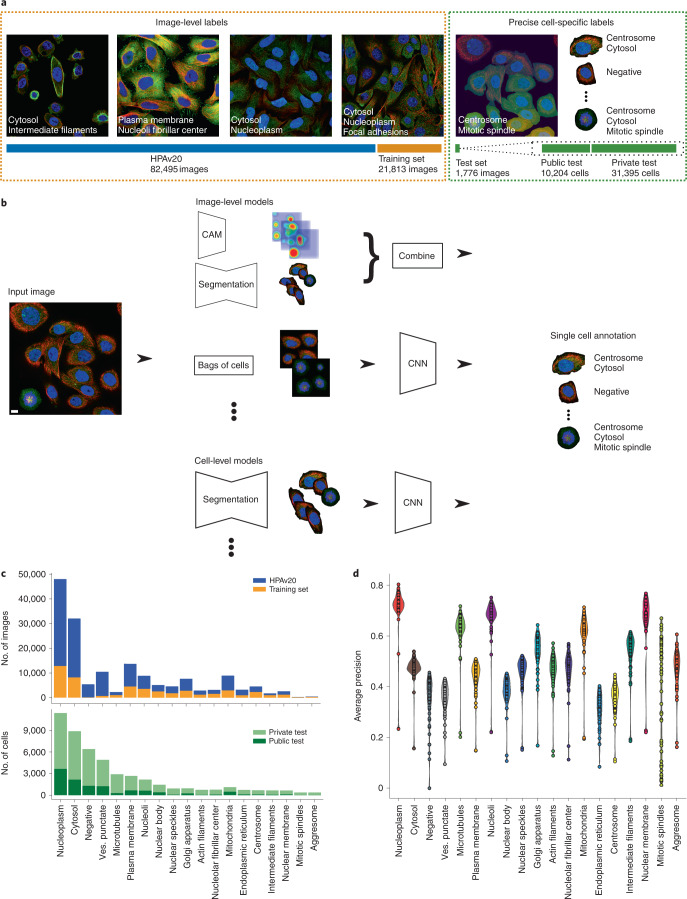
Fig. 1. Challenge overview.
a, For training, participants were given access to a well-balanced training set and the public HPA dataset, which consists of fluorescent images with four channels and corresponding image-level labels. To evaluate the solutions’ performance, a private (hidden) dataset of 1,776 images containing 41,000 single cells with corresponding single-cell labels was used. b, Overview of the main approaches: image-level models take in images and predict image-level labels, which can be combined with CAMs of different classes and segmented cell regions to give the final cell-level labels. Image-level models can also be trained on whole images, but predict on bag-of-cell tiles at inference to produce the cell labels. Cell-level models take in single-cell crops and predict single-cell labels. c, Number of images and cells per class in the training set and test set. d, Violin plot of the score distribution per label for the top 50 teams, ordered by decreasing cell count. n = 50 teams for each violin. The minimum, mean, percentile, and maximum values are noted in Supplementary Fig. 3. Ves. punctate, vesicles and punctate pattern. Scale bar, 10 μm.

