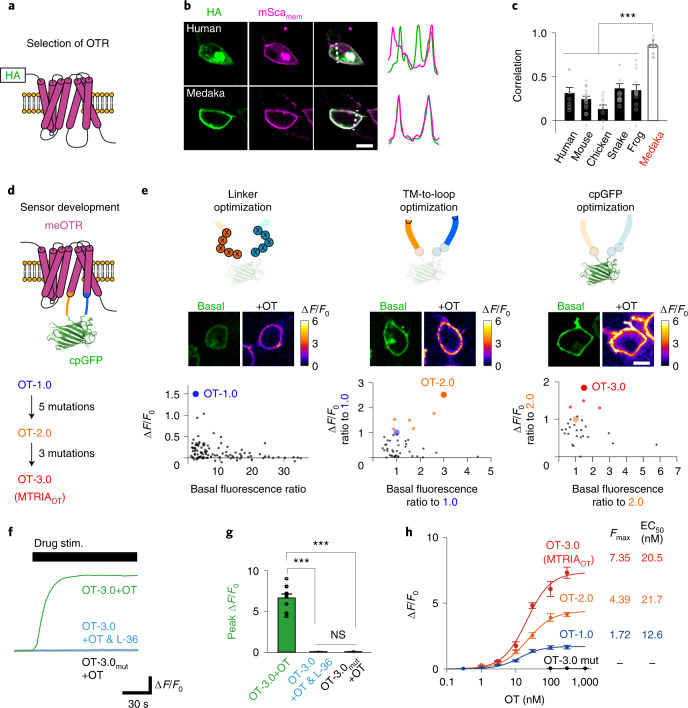
Fig. 1. Development of a fluorescent oxytocin sensor.
a, Schematic of a PM-localized OTR conjugated with an HA-tag at the N terminus. b, Images of HEK293T cells coexpressing an HA-tagged OTR (HA, green) and PM-targeted mScarlet (mScamem, magenta). Traces on right compare the normalized fluorescence intensities of HA and mScamem signals along the dotted lines. c, Summary of Pearson correlation coefficients of fluorescence signals in b (n = 8, 17, 10, 10, 12 and 17 cells for human, mouse, chicken, snake, frog and medaka, respectively). Statistics used were one-way analysis of variance (ANOVA; F5,68 = 2.35, P = 4.9 × 10⁻¹⁹) with Bonferroni post hoc test (P = 3.3 × 10⁻⁹, human versus medaka; P = 8.9 × 10⁻⁹, mouse versus medaka; P = 5.4 × 10⁻¹⁴, chicken versus medaka; P = 2.4 × 10⁻¹⁹, snake versus medaka; P = 2.3 × 10⁻⁸, frog versus medaka). d, Schematic of the sensor architecture. e, Development of a sensitive fluorescent OT sensor over a three-step screening; optimization of linker regions, TM-to-loop region and cpGFP moiety. Schematics of mutagenesis (top), basal fluorescence images and heat maps depicting responses to 100 nM OT (middle), and scatterplots describing the relationship between basal brightness and the fluorescence response to 100 nM OT (bottom). f, Representative traces of fluorescence responses upon simulation with the indicated drug (green, OT-3.0-expressing cells upon stimulation with OT; cyan, OT-3.0-expressing cells upon stimulation with a mixture of OT and L-36; gray, OT-3.0-mut-expressing cells upon stimulation with OT). g, Summary of peak ΔF/F0 values (n = 10 cells per group). Statistics used were one-way ANOVA (F2,27 = 3.35, P = 5.7 × 10⁻¹⁶) with Bonferroni post hoc test (P = 4.3 × 10⁻¹⁰, left versus middle; P = 4.3 × 10⁻¹⁰, left versus right; P = 1, middle versus right). h, Dose–response curves of sensors (n = 10 cells per point). Fmax and EC50 values are summarized on the right. Scale bars, 10 µm (b and e). Graphs represent the mean ± s.e.m. (c, g and h). ***P < 0.001, NS, not significant (c and g).

