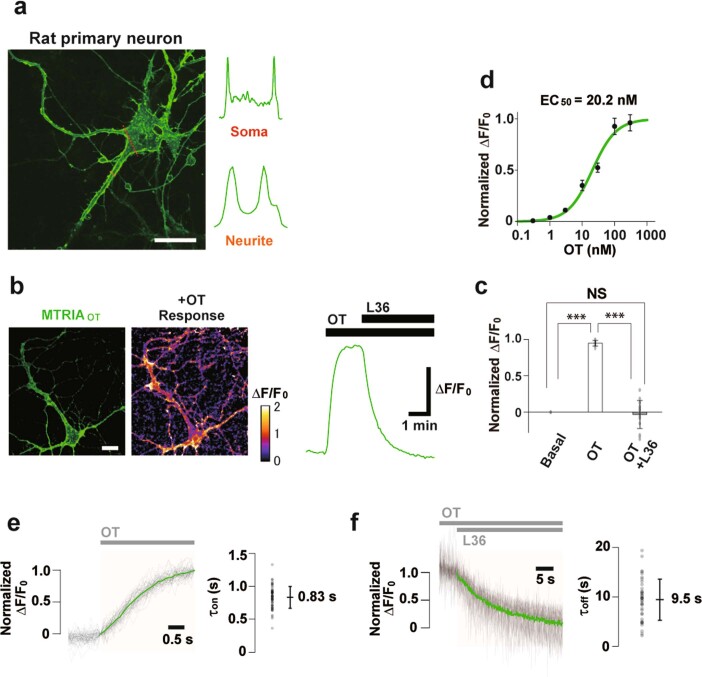
Extended Data Fig. 4. The basic properties of MTRIAOT in rat hippocampal primary neurons.
a, Representative image showing a rat primary neuron expressing MTRIAOT and profiles of fluorescence intensities along the dotted lines (red: soma, orange: neurite). b, Fluorescence image (left), heatmap image depicting the response to 300 nM OT (middle), and representative trace of MTRIAOT response upon 300 nM OT and subsequent 1 μM L36 (right). c, Summary of ΔF/F0 responses normalized by a peak value during OT stimulation (n = 15 cells). Statistics: one-way ANOVA (F2, 42 = 3.22, P = 3.5 × 10⁻²⁷) with Bonferroni post-hoc test (P = 1.0 × 10⁻²⁰: Basal vs. OT, P = 8.1 × 10⁻¹¹: OT vs. OT + L36, P = 1: Basal vs. OT + L36). d, Dose-response curves of MTRIAOT in primary neurons (n = 18, 24, 26, 18, 15, 35, and 42 cells for 0.3, 1, 3, 10, 30, 100, and 300 nM, respectively). Values were normalized against a maximum value of the fitted-sigmoidal curve. e–f, Traces showing the kinetics of MTRIAOT in the fluorescence rise (e left: τon) upon 5 μM OT and decay (f left: τoff) upon 300 nM OT and subsequent 1 μM L36 (gray: each trace, green: average trace; n = 59 cells in e and 38 cells in f). Time constants determined by a single-exponential fitting are summarized to the right. Scale bars, 20 µm (a) and 30 µm (b). Graphs represent mean ± SEM (c, d) and mean ± SD (e, f). ***P < 0.001, NS: not significant (c).

