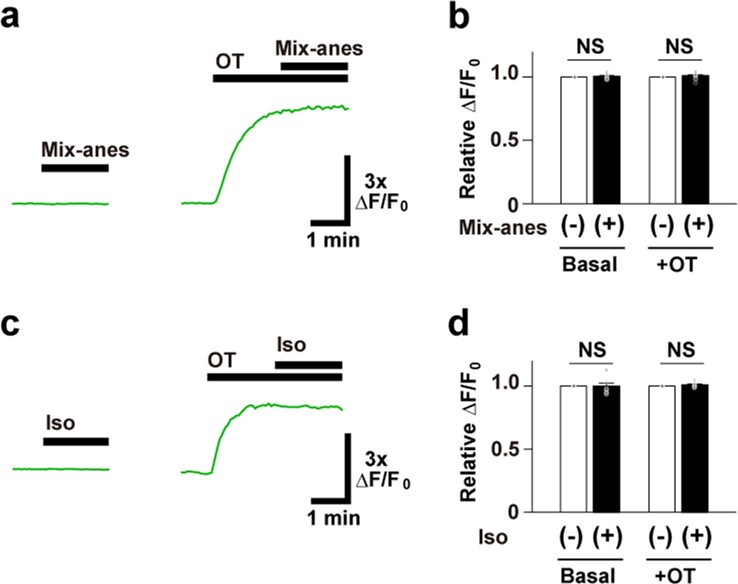
Extended Data Fig. 7. Effects of anesthetic drugs on MTRIAOT fluorescence level in HEK293T cells.
a, Representative traces (left: basal fluorescence level, right: OT-induced response) showing the dependence of MTRIAOT fluorescence intensity on mix-anes (0.11 mg/mL dexmedetomidine hydrochloride, 0.6 mg/mL midazolam, and 0.75 mg/mL butorphanol tartrate). b, Summary of ΔF/F0 responses by the value just before mix-anes application (n = 10 cells). Statistics: paired two-tailed t-test (P = 0.48: Basal, P = 0.24: +OT). c, Representative traces (basal fluorescence level: left, OT-induced response: right) showing the dependence of MTRIAOT fluorescence intensity on isoflurane (1:100 dilution). d, Summary of ΔF/F0 responses by the value just before isoflurane application (n = 10 cells). Statistics: paired two-tailed t-test (P = 0.97: Basal, P = 0.18: +OT). Graphs represent mean ± SEM (b, d). NS: not significant (b, d).

