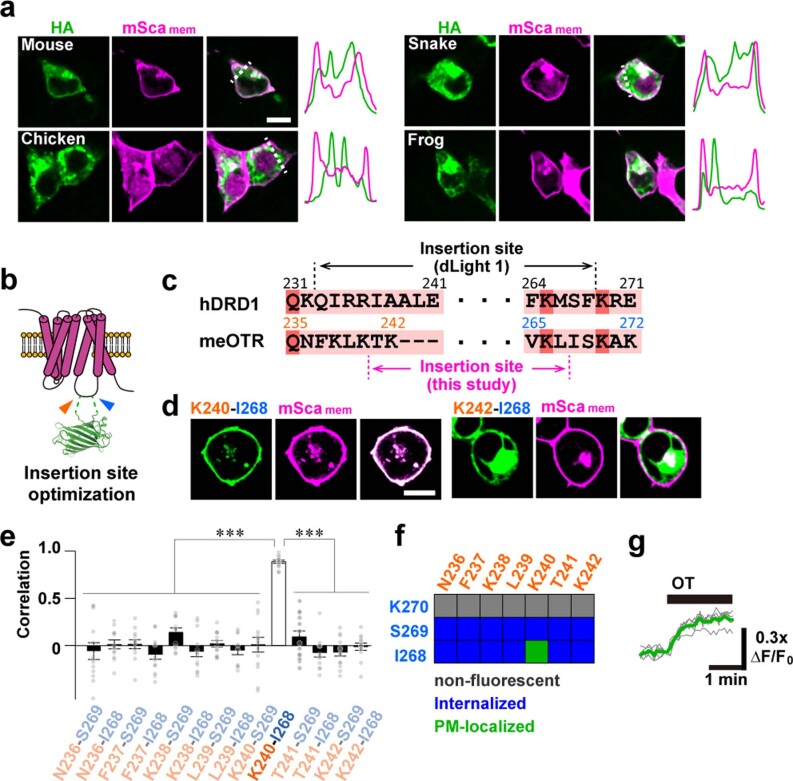
Extended Data Fig. 1. Optimization of a fluorescent OT sensor.
a, Representative images of HEK293T cells co-expressing an HA-tagged OTR (green) and a mScamem (magenta). Normalized fluorescence intensities on the dotted lines are shown on the right. b, Schematic representation of cpGFP insertion into the IL3 of OTR. c, Sequence alignment of regions of the IL3 of human dopamine receptor D1 (hDRD1), a scaffold of a dopamine sensor (dLight1), and meOTR. d, Representative images of HEK293T cells co-expressing the indicated meOTR-cpGFP chimera (green) and mScamem (magenta). e, Pearson correlation coefficients comparing meOTR-cpGFP chimeras and mScamem are summarized as mean ± SEM (n = 13, 12, 12, 13, 12, 13, 13, 11, 13, 13, 13, 12, 13, and 12 cells; left to right). Statistics: one-way ANOVA (F13,167 = 1.78, P = 5.5 × 10⁻³²) with Bonferroni post-hoc test (P = 5.1 × 10⁻⁹: N236–S269, P = 7.9 × 10⁻¹⁴: N236–I268, P = 1.2 × 10⁻¹³: F237–S269, P = 4.1 × 10⁻¹⁴: F237–I268, P = 3.1 × 10⁻¹²: K238–S269, P = 4.9 × 10⁻¹⁴: K238–I268, P = 1.6 × 10⁻¹⁶: L239–S269, P = 2.9 × 10⁻¹⁴: L239–I268, P = 1.2 × 10⁻⁹: K240–S269, P = 9.6 × 10⁻¹¹: T241–S269, P = 5.4 × 10⁻¹⁵: T241–I268, P = 2.7 × 10⁻¹⁶: K242–S269, P = 2.0 × 10⁻¹⁶: K242–I268, compared with K240–I268). ***P < 0.001. f, Summary of insertion site-dependent characteristics of meOTR-cpGFP chimeras. g, Traces showing fluorescence responses of the K240–I268 meOTR-cpGFP chimera upon stimulation with 100 nM OT. Scale bars, 10 µm (a, d).

