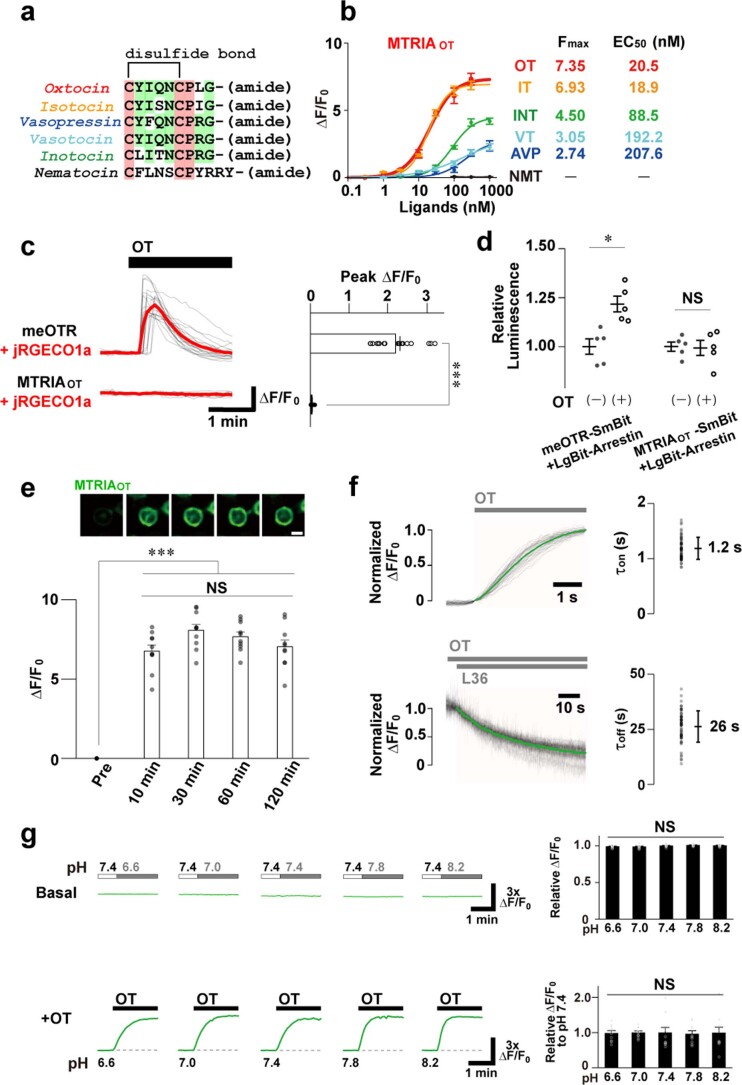
Extended Data Fig. 3. The basic properties of MTRIAOT in HEK293T cells.
a, Sequence alignment of OT and its orthologous neuropeptides. b, Dose-response curves of MTRIAOT to OT and its orthologous neuropeptides (n = 10 cells per point). c, Assay for G protein coupling. Traces of jRGECO1a fluorescence responses in either meOTR- or MTRIAOT-co-expressing cells upon stimulation with 100 nM OT (gray: each trace, red: average trace). Summary of peak ΔF/F0 responses are shown on the right (n = 20 cells). d, Assay for β-arrestin coupling. Traces showing the relative luminescence increase induced by NanoLuc luciferase complementation upon stimulation with 100 nM OT (n = 5 wells). e, Time-course of the fluorescence intensity of MTRIAOT over 120 min following 100 nM OT stimulation. Representative images (top) and summary of ΔF/F0 responses (bottom: n = 10 cells). f, Traces showing the kinetics of MTRIAOT in the fluorescence rise (top left: τon) upon 5 μM OT and decay (bottom left: τoff) upon 300 nM OT and subsequent 10 μM L36 (gray: each trace, green: average trace; n = 60 cells). The time constants determined by a single-exponential fitting are summarized to the right. g, Representative traces showing the dependence of MTRIAOT fluorescence intensity on extracellular pH (left top: basal fluorescence levels, bottom: OT-induced responses). Summary of basal fluorescence levels normalized by the value just before pH change (right top: n = 10 cells) and OT-induced responses formalized by the mean of ΔF/F0 at pH 7.4 (right bottom: n = 10 cells). Scale bar, 10 µm (e). Graphs represent mean ± SEM (b–e, g) and mean ± SD (f). ***P < 0.001, *P < 0.05, NS: not significant (c–e, g). Statistics (b, d, e, g) are summarized in Supplementary Note 4.

