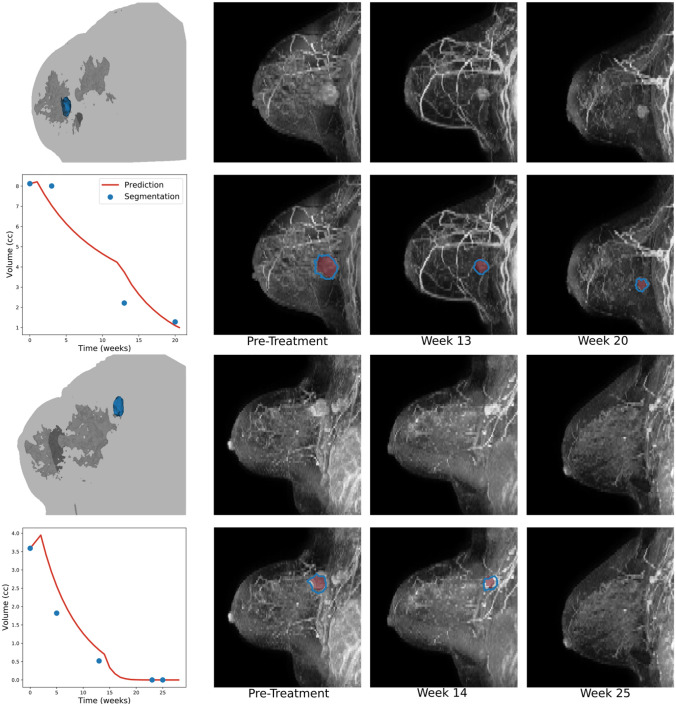
Fig. 2.
A Biophysical Simulation Predicts Change in Volume and Morphology Throughout Treatment. Representative examples of model predictions showing how the tumor volume changes in response to therapy. A three-dimensional rendering of the breast segmentation derived from DCE-MRI depicting the tumor (blue), glandular tissue (dark gray), and the outline of the patient's body (light gray) at time of diagnosis is shown for each patient. The three-dimensional model is used as input to the model, which predicts change in volume over the treatment course. Predicted tumor volume (red) matches well with segmentations of from intra-treatment MRIs (blue). Examples of patients with residual globular (top) and multi-centric (bottom) tumors are shown, along with an example of a patient achieving pCR (middle)

