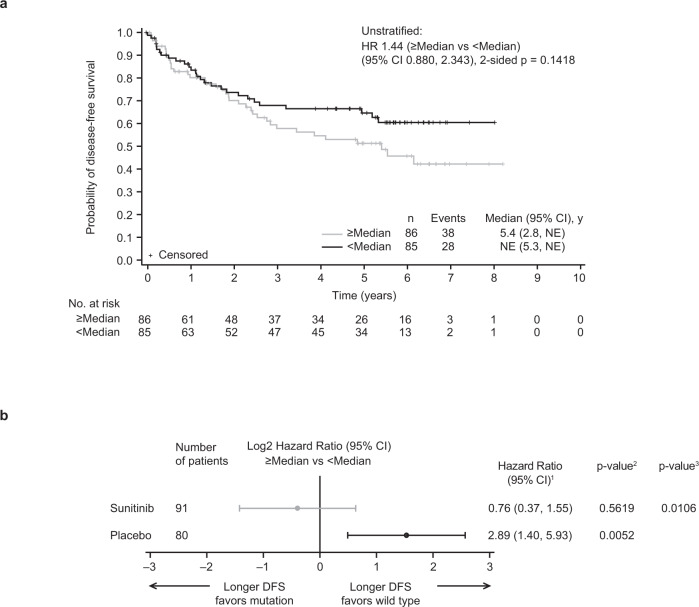
Fig. 2. DFS association with TMB.
a Kaplan–Meier plot for TMB in the overall cohort and b treatment arm effect of TMB and DFS association stratified by median cutoff. Data are presented as HR and 95% CI. 1Cox proportional hazards model with <Median as the reference group was used to calculate HR and 95% CI. 2Log-rank two-sided test was performed to compare between overall median cutoff groups. A HR <1 indicates better survival in the ≥Median group, while a HR >1 indicates better survival in the <Median group. HR reference level is <median, p-value is from Logrank test. 3Two-sided p-value for overall median cutoff-by-treatment interaction from Cox model with treatment group and median cutoff status as two independent variables. CI confidence interval, DFS disease-free survival, HR hazard ratio, NE not estimable, TMB tumor mutational burden.

