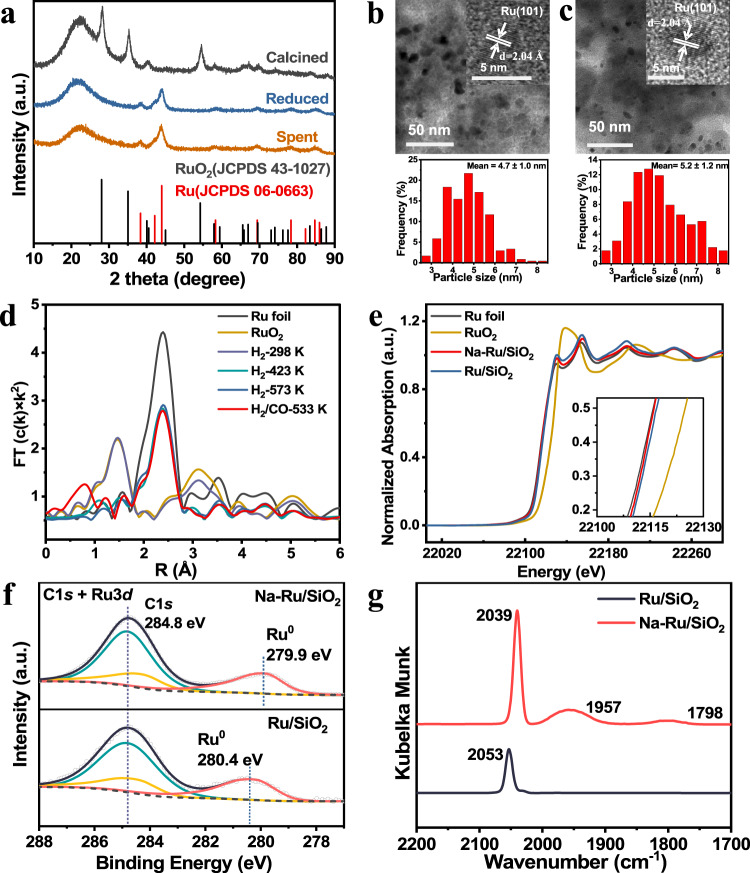
Fig. 2. Characterization of Na-Ru/SiO2 and Ru/SiO2 catalysts.
a XRD patterns of Na-Ru /SiO2 at different stages. b, c (HR)TEM images and size distribution of Ru NPs for Na-Ru/SiO2. b Reduced sample; c Spent sample. [Insets: Lattice fringes with distance of 2.04 Å corresponding to the Ru (101) crystal plane shown in (b, c)]. d Ru K-edge FT EXAFS spectra under different conditions on Na-Ru/SiO2. e Ru K-edge X-ray absorption near-edge structure (XANES) spectra of Na-Ru/SiO2, Ru/SiO2, RuO2, and Ru foil. f C 1 s and Ru 3d photoemission spectra of reduced Ru/SiO2 and Na-Ru/SiO2. g DRIFTS spectra of adsorbed CO on Ru/SiO2 and Na-Ru/SiO2 at 323 K.

