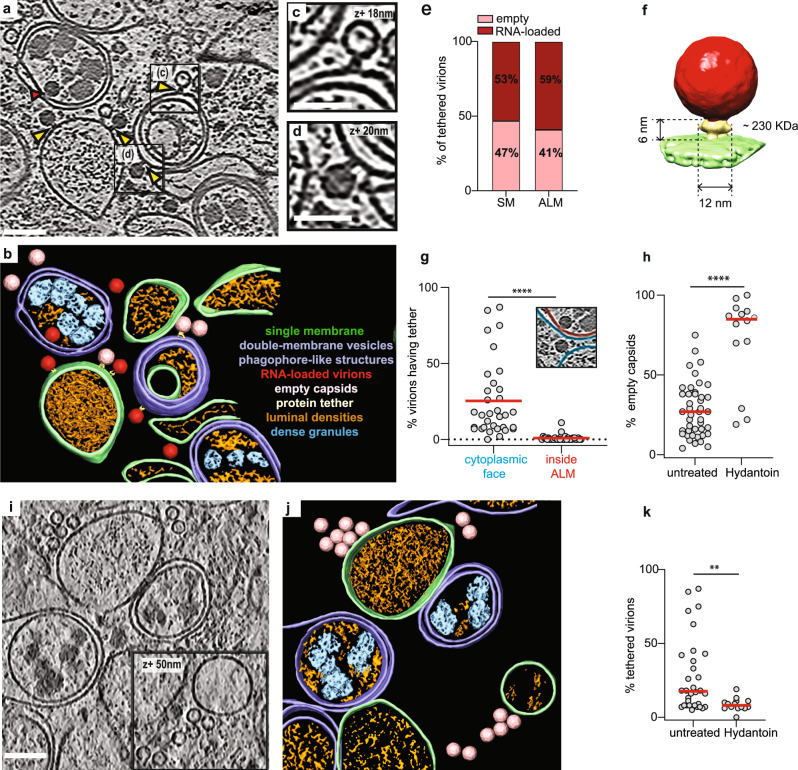
Fig. 1. Cryo-electron tomography allows the visualization of poliovirus replication and assembly sites in situ.
a Slice through a representative cryo-electron tomogram of a lamella milled through a PV-infected cell at 6 h p.i., revealing PV-induced SM (single membranes) and ALM (autophagy-like membranes) proliferation. Yellow arrowheads indicate densities tethering intracellular empty capsids and darker RNA-loaded virions to membranes. Red arrowhead indicates a virion enclosed inside a DMV (double-membrane vesicle), proximal but not tethered to the membrane. b Segmentation of the tomogram presented in (a). Color labels are defined for each structure. Empty capsids (pink) and RNA-loaded virions (red) are represented by their subtomogram averages. c, d Magnified view of an empty capsid and RNA-loaded virion tethered to a DMV shown in (a) with black boxes. e Percentage of empty (n = 223) and RNA-loaded virions (n = 281) observed on SM and ALM. f Subtomogram average of the tethered viral capsid at 70 Å resolution. Its height and width are marked, and its molecular mass is estimated to be ~230 kDa. g Percentage of (n) virions observed on the outside (n = 520, blue) and inside (n = 22, red) of ALM having a visible tether to a membrane as indicated in the inset. h Percentage of empty capsids observed in (n) tomograms of untreated (n = 43) and Hydantoin-treated cells (n = 14) at 6 h p.i., as measured by template matching. Horizontal lines represent the average. i Cryo-electron tomogram of a PV-infected, Hydantoin-treated cell at 6 h p.i., containing several empty capsids which are not tethered to the surrounding membranes. j Segmentation of the tomogram in (i). Color labels for each structure are the same in (b) and empty capsids are represented by their subtomogram average. k Percentage of tethered virions as observed in (n) cryo-tomograms of untreated (n = 33) and Hydantoin-treated (n = 14) cells at 6 h p.i. Horizontal lines represent the average. In all graphs, each dot corresponds to one tomogram analyzed (see also Supplementary Table 2). Statistical significance by unpaired two-tailed Student’s t test: g ****p < 0.0001, h **p = 0.0138, k **p = 0.0089. Scale bars: a–i 100 nm, c, d 50 nm.

