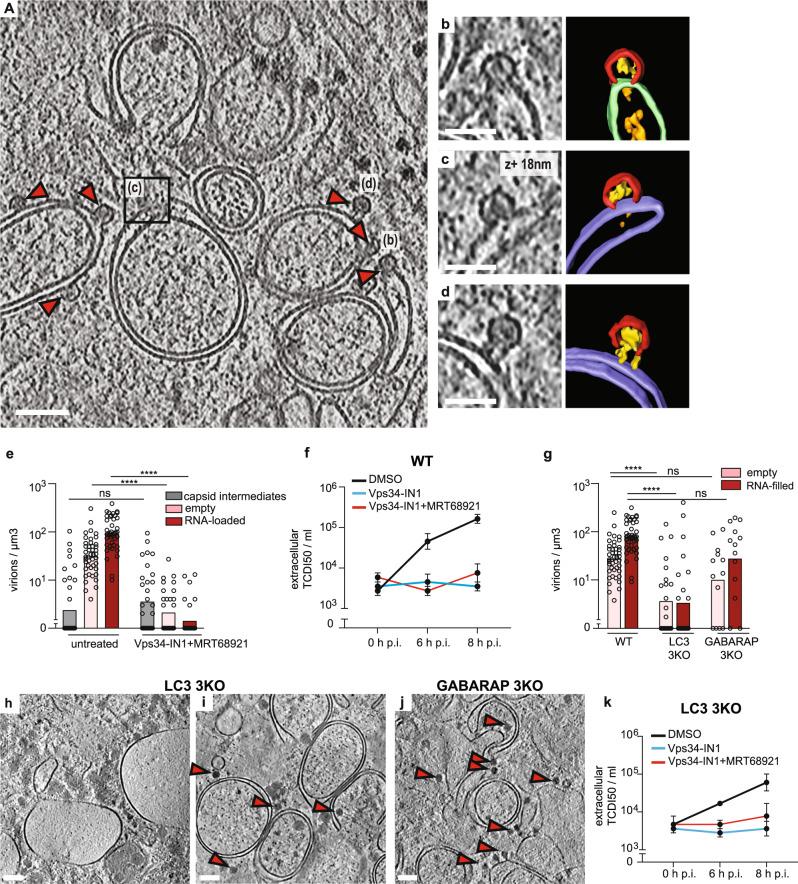
Fig. 3. VPS34 inhibition stalls PV assembly at the half-capsid intermediate.
a Cryo-electron tomogram of a PV-infected cell co-treated with Vps34-IN1 and MRT68921 at 6 h p.i. b–d Magnified views of capsid intermediates indicated in (a), and their corresponding segmentations. Capsid intermediates (red), intra-capsid densities (yellow), ALM (purple), SM (green), luminal densities (orange). d The magnified view shows a near-complete capsid tethered to a double-membrane vesicle. e Concentration of intracellular capsid intermediates, empty capsids and RNA-loaded virions as observed in (n) tomograms of untreated (n = 51) and Vps34-IN1 + MRT68921 (n = 32) treated cells at 6 h p.i., bars represent the averages (see also Supplementary Table 2). Statistical significance by unpaired two-tailed Student’s t test; ****p < 0.0001. f Released virus titer at 0, 6, and 8 h p.i. in WT cells treated with DMSO, Vps34-IN1, and Vps34-IN1 + MRT68921. Bars represent the means of biological triplicates ± SEM. g Concentration of intracellular empty capsids and RNA-loaded virions observed in (n) tomograms WT (n = 51), LC3 (n = 24), and GABARAP 3KO (n = 13) cells at 6 h p.i. Statistical significance by unpaired two-tailed Student’s t test; ****p < 0.0001. h, i Slices through representative cryo-electron tomograms of lamellas milled through PV-infected LC3 3KO cells at 6 h p.i., revealing two types of membrane proliferation: large single-membrane vesicles (h) and ALM proliferation (i). j Slice of cryo-tomogram of a GABARAP 3KO PV-infected cell at 6 h p.i., where ALMs were observed. (h–j) Red arrowheads indicate the presence of RNA-loaded virions. k Time course of PV release from LC3 3KO cells in the presence or absence of autophagy inhibitors as indicated in the figure. Error bars represent the means of biological triplicates ± SEM. Scale bars: a 100 nm, b–d 50 nm, h–j 200 nm.

