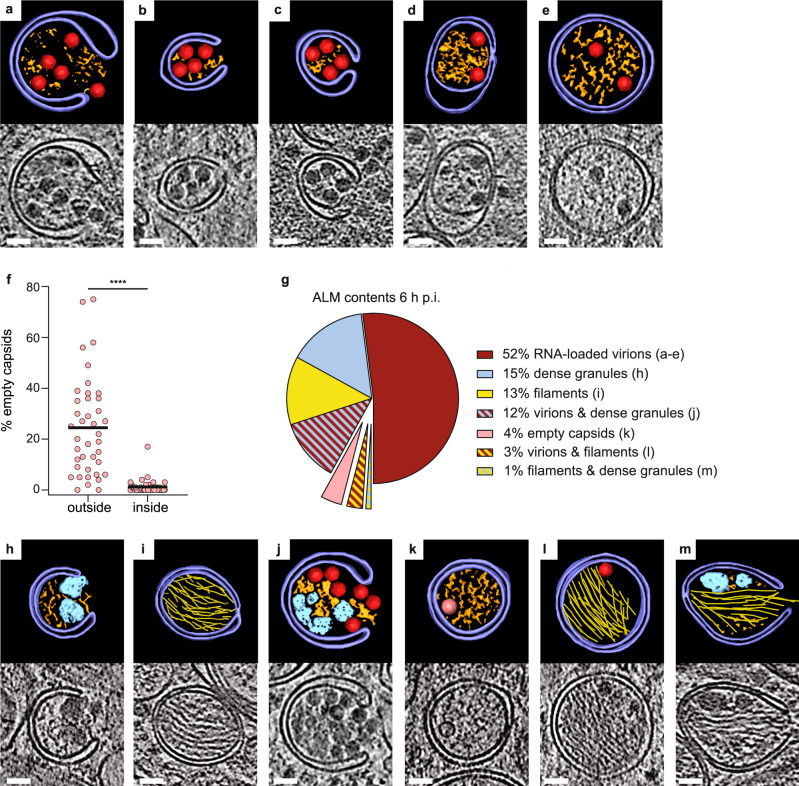
Fig. 5. Autophagy-like membranes select and sort their contents in PV-infected cells.
a–e Tomograms of PV-infected cells at 6 h p.i. showing different stages of engulfment of RNA-loaded virions by ALMs, including initial recruitment to phagophores (a–c) and enclosure in DMVs (d, e). Each panel contains a slice through the tomogram and the corresponding segmentation, colored as in Fig. 1b. f Percentage of empty capsids on the outside and inside of ALMs. Each dot corresponds to one tomogram analyzed (n = 41); horizontal line is the average (see also Supplementary Table 2). g Relative abundance of seven classes of ALMs by contents (single/mixed), in tomograms of PV-infected cells at 6 h p.i. h–m Segmentations and corresponding tomographic slices of examples of the different ALM classes, as labeled in (g). Colors are as in Fig. 1b. Protein filament bundles are shown in yellow. Statistical significance by unpaired two-tailed Student’s t test; ****p < 0.0001. Scale bars: 50 nm.

