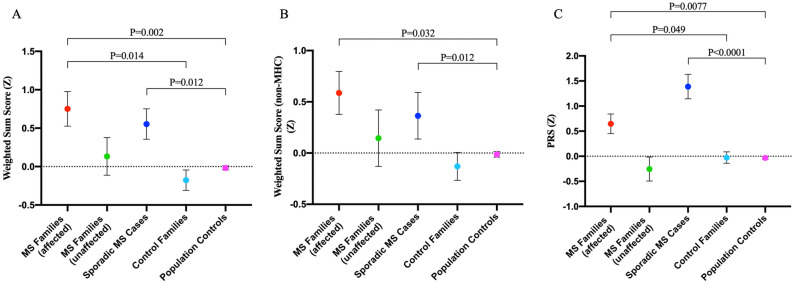
Figure 3.
Weighted sum scores and polygenic risk scores (PRS) are higher in the affected members of MS families compared with the control families and healthy population controls. (A) Comparisons of weighted sum scores that include both MHC and non-MHC alleles among the study groups. (B) Comparisons of weighted sum scores that include only non-MHC alleles among the study groups. (C) Comparisons of PRS values among the study groups. Logistic regression analysis. Data are mean ± s.e.m. P < 0.05, significant.

