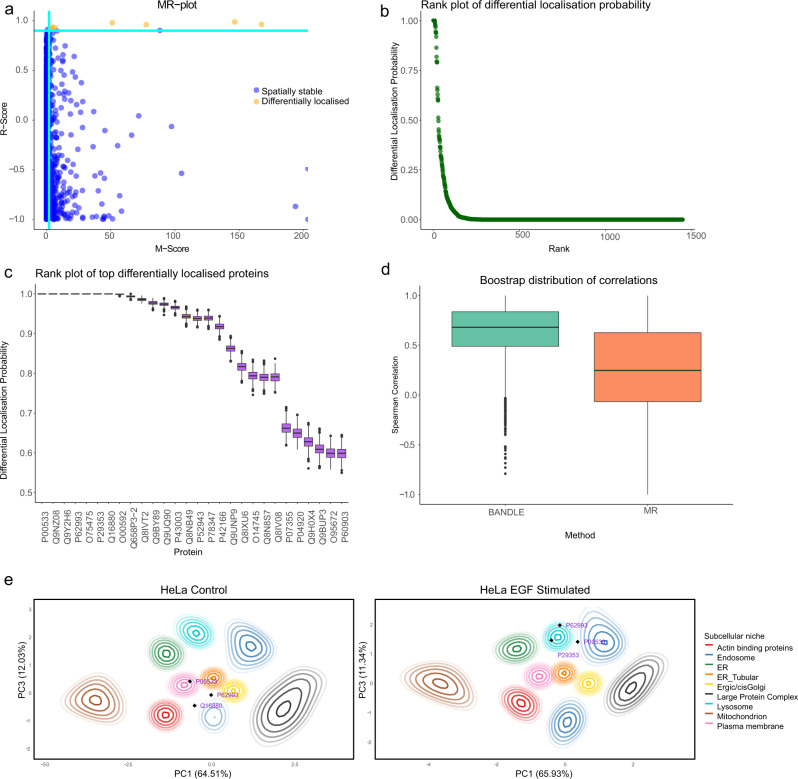
Fig. 4. Analysis of an EGF stimulation dataset.
a An MR-plot where dark green lines are drawn at suggested threshold and hits are highlighted in orange. b BANDLE rank plot showing the distribution of differentially localised proteins. c The top differentially localised proteins from BANDLE plotted with uncertainty estimates. d Bootstrap distributions of correlations with a phosphoproteomic time-course experiment. The BANDLE confidence intervals differ significantly from 0, while the MR method do not. 5000 bootstrap samples were used with data presented as medians with notches representing the interquartile range (IQR), and the whiskers extending to 1.5*IQR. e PCA plots with (smoothed) localisation probabilities project onto them. Each colour represents an organelle and ellipses represent lines of isoprobability. The inner ellipse corresponds to 0.99 and the proceed line 0.95 with further lines decreasing by 0.05 each time. The annotated proteins demonstrate examples of differential localisations. EGFR (P005330) clearly relocalises from the PM to endosome, while SHC-1 (P29353) and GRB2 (P62993) relocalise from unknown localisation to the lysosome. Source data are provided as a Source Data file in the Supplementary Material.

