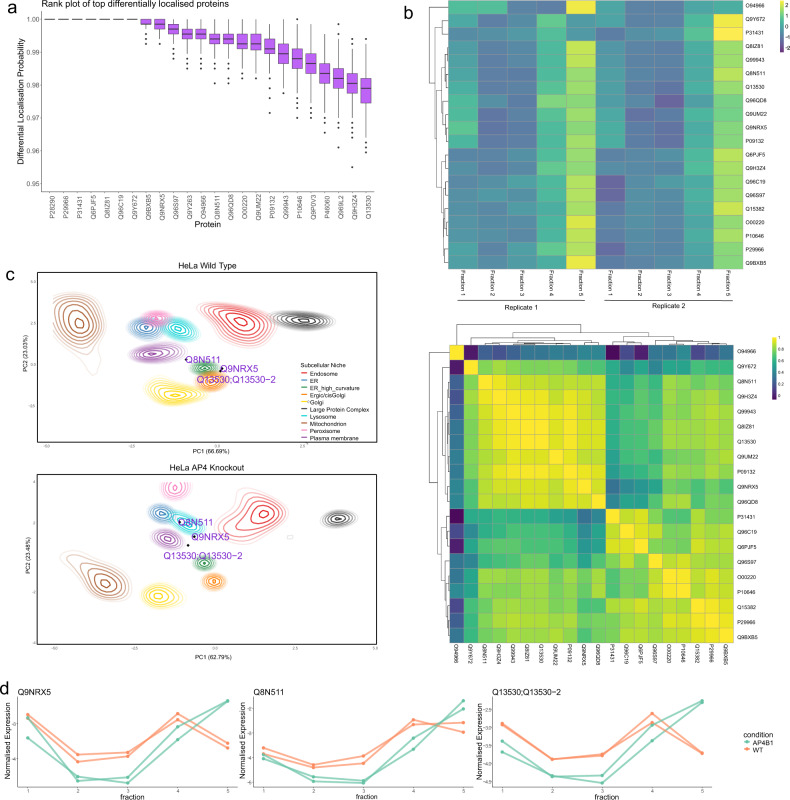
Fig. 5. BANDLE applied to the AP-4 dataset.
a The top differentially localised proteins from BANDLE plotted with uncertainty estimates. Data are presented as medians with notches representing the interquartile range (IQR), and the whiskers extending to 1.5*IQR. 667 MCMC samples were used. b A Spearman correlation heatmap showing strong correlation behaviours of proteins that have AP-4 dependent localisation (lower). Normalised mass-spectrometry profiles plotted as a heatmap from the AP-4 knockout data. Proteins are shown to have similar behaviour with greater intensity in fraction 5, where light membrane organelles are likely to pellet (upper). c PCA plots with (smoothed) localisation probabilities project onto them. Each colour represents an organelle and ellipses represent lines of isoprobability. The inner ellipse corresponds to 0.99 and the proceed line 0.95 with subsequent lines decreasing by 0.05 each time. The proteins SERINC 1 and 3, as well as TMEM199 are highlighted demonstrating example relocalisations. d Normalised abundance profiles showing that SERINC 1, SERINC 3 and TMEM199 show similar behaviour upon knockout of AP-4. Source data are provided as a Source data file in the Supplementary Material.

