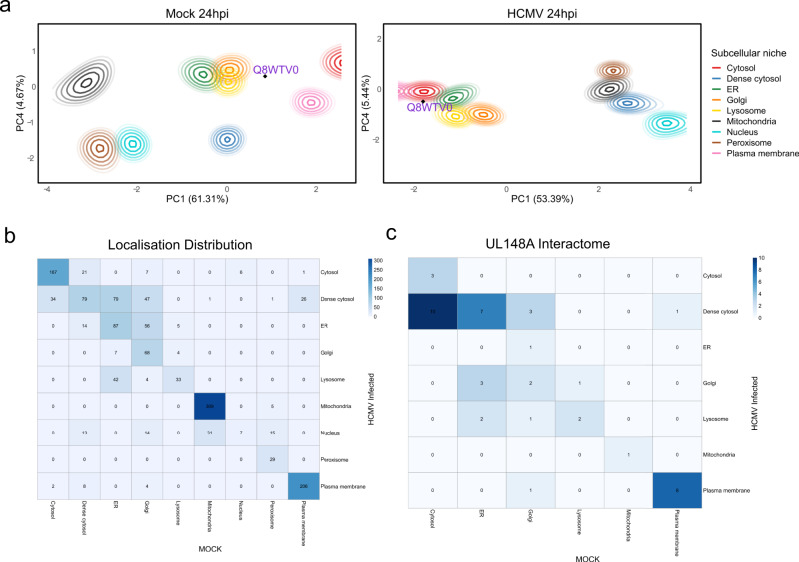
Fig. 6. BANDLE applied to the HCMV dataset.
a PCA plots with (smoothed) localisation probabilities projected onto them. Each colour represents a subcellular niche and ellipses represent lines of isoprobability. The inner ellipse corresponds to 0.99 and the proceed line 0.95 with further lines decreasing by 0.05 each time. The relocalisation of SCARB1 is highlighted on the plot. b The spatial allocation derived from BANDLE where each entry of the heatmap is the number of proteins. Off-diagonal entries only include confident differential localisations with probability >0.999. c UL148A interactome mapped onto the BANDLE determined spatial patterns. Source data are provided as a Source data file in the Supplementary Material.

