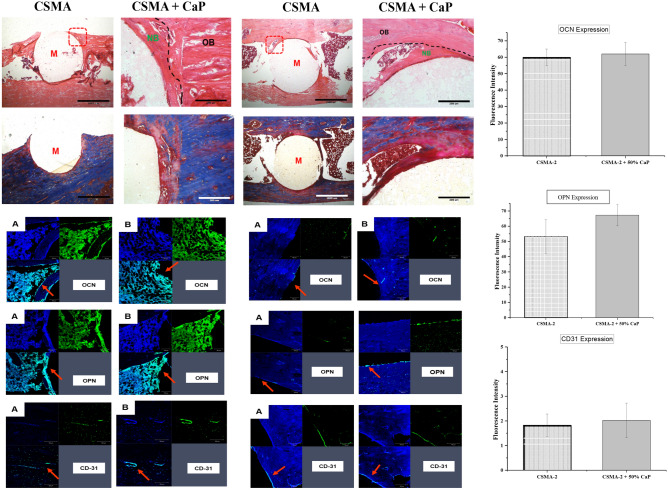
Figure 11.
Histological evaluation and illustration of H&E and Masson’s Trichome stains 4- and 8-weeks post-implantation of CMSA and CSMA + CaP: a general overview of the sectioned samples can be observed where a network of collagen fibres is present. In both CSMA and CSMA + CaP implants, cells (white arrow) can be seen around the implant interphase with the native bone. Morphology of the cytoplasmic structures is also visible in both samples. The mineralised bone is presented in blue which contains a cluster of osteoblast-like cells. Bottom images show an assessment of non-collagenous proteins, OPN/OCN and CD31I markers 4- and 8-weeks post-implantation of CSMA (A) and CSMA + CaP (B): there is a clear difference between 4- and 8-weeks observations in CSMA-based implants where a full network of cells at the border of the native bone, particularly can be observed. Overall, the spreading of the cells is in a uniform pattern across both formulations. Finally, expression of OCN, OPN and CD31 in CSMA and CSMA + CaP was calculated 8 weeks post-implantation: the fluorescence intensity measurements were carried out by ImageJ analysis software to record the intensity within regions of interest (ROIs). Subsequently, a thresholding tool was used to quantify the staining intensity. To compare 3 antibodies across all specimens, staining and image acquisition were performed in parallel for the entire set, where no significant difference can be observed (p > 0.05, n = 3).

