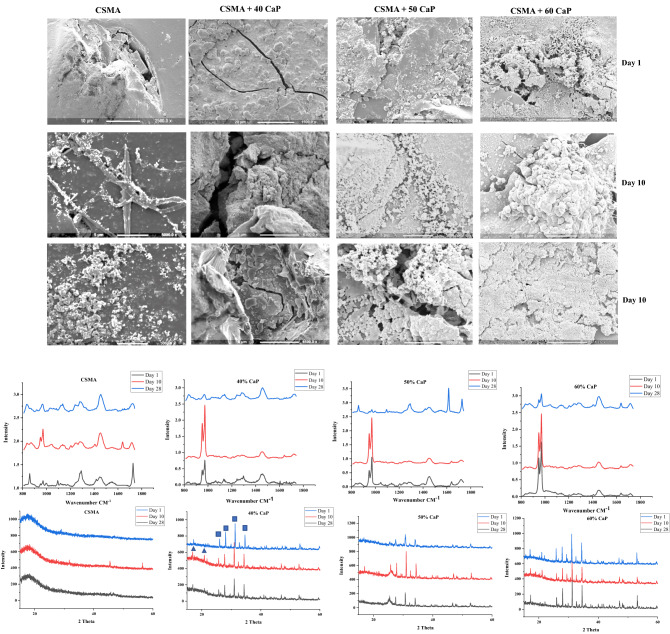
Figure 4.
SEM present a series of images of CaP deposition on the surface of the composite discs compared to CSMA. 60% CaP formulation displays the highest quantity of precipitants on the surface, followed by 50 and 40% formulations respectively. Raman microscopy on the first bottom row shows the highest peak at 50% formulation followed by 60 and 40. Subsequently, the presence of CaP precipitates observed via SEM microscopy was confirmed through XRD analysis 1, 10, and 28-days post SBF immersion and incubation.

