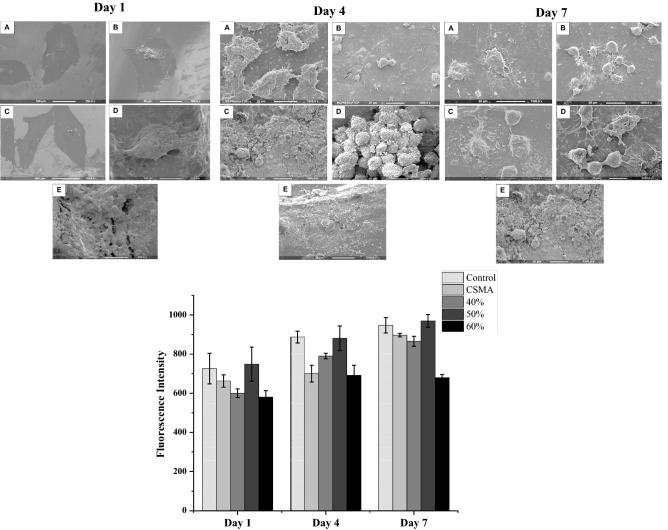
Figure 5.
SEM images showing MC3T3 cell proliferation on the surface of control (A), CSMA (B), 40% CaP (C), 50% CaP (D) and 60% CAP (E) at 1-, 4- and 7-days post-incubation in culture media. Topographical changes can be observed as a function of surface remineralisation, this is particularly apparent at day 7 in D. A uniform layer of cells with clear morphology can also be seen at days 1 and 4 confirming spreading and integration of the cells throughout the surface of the polymer and CaP incorporated discs. Alamar blue metabolic activity of MC3T3 cells on polymer plus 40, 50 and 60% CaP composites, presented on left, shows 50% CaP disc and CSMA did not show any significant difference in the fluorescence intensity value compared to control. The lowest cell proliferation was observed in the 60% CaP disc with exhibiting significantly lower metabolic activity readings (p < 0.05) compared to the remaining discs, this was followed by 40%. The highest statistically significant formulations are presented with an asterisk on top of this graph.

