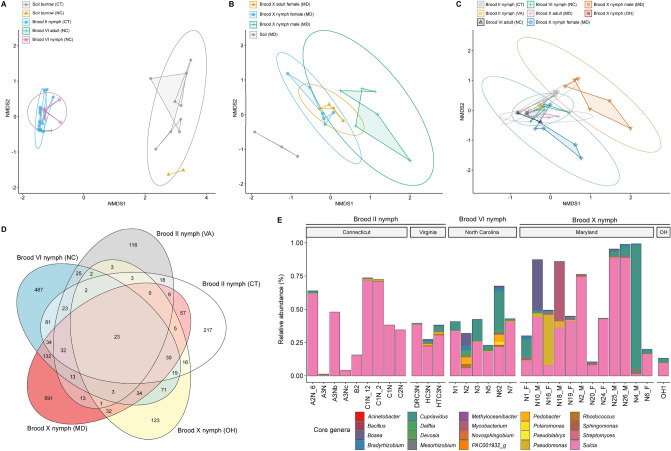
Figure 3.
Beta diversity indices. NMDS plot of nymph gut microbiomes and microbiomes of (A) soil inhabited by nymphs in CT (Brood II) and NC (Brood VI), (B) Brood X gut microbiomes and microbiomes of soil in MD, and (C) cicada gut microbiomes showing life stage, brood, collection location, and sex of Brood X cicadas. Ellipses represents 95% confidence interval based on Bray–Curtis dissimilarity index. (D) Venn diagram of bacterial communities showing the number of shared and exclusive bacterial taxa is shown relative to MTP set. (E) Relative abundance of 20 most common core bacterial genera detected across all MTP sets.

