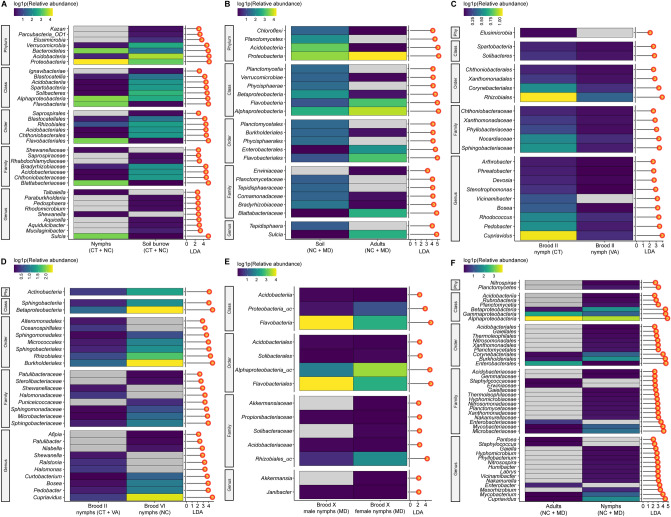
Figure 6.
Taxonomic biomarkers calculated using LEfSe32. Heatmap (left) provides log1010 (relative abundance) of taxonomic biomarkers at the genus level. Bar plot (right) shows linear discriminant analysis (LDA) effect size used to support high-dimensional class comparisons of (A) Brood II nymphs (CT) and Brood VI nymphs (NC) versus soil inhabited by nymphs (CT and NC), (B) Adults (Brood X, MD, and Brood VI, NC) versus soil (MD and NC), (C) Brood II (CT) versus Brood II (VA), (D) Brood II nymphs (CT and VA) versus Brood VI nymphs (NC), (E) Brood X male nymphs (MD) versus Brood X female nymphs (MD), and (F) Adults (Brood X, MD, and Brood VI, NC) versus nymphs (Brood X, MD, and Brood VI, NC).

