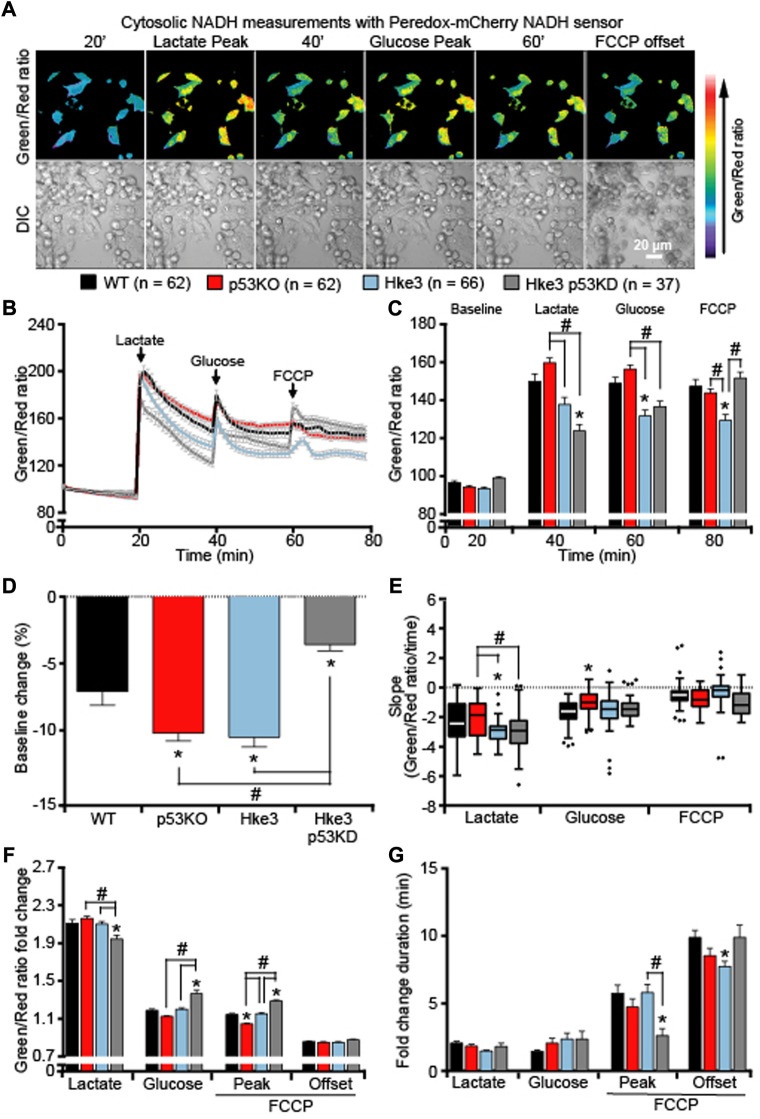
FIGURE 5.
Cytosolic NADH oxidation following substrates addition depends on a correct expression of both TP53 and KRAS. WT, p53 KO, Hke3 and Hke3 p53 KD HCT-116 cells were separately transfected with the cytosolic-targeted NADH-sensitive Peredox-mCherry fluorescent probe, mounted on the heated stage of an LSM 710 confocal microscope and assayed over 80 min at 37°C. Cells were exposed as mentioned and illustrated in Figure 1A. DIC and fluorescent measurements were recorded for GFP and mCherry by time-lapse confocal microscopy. (A) Peredox imaging data are shown as a ratio images of Green (excitation with 405 nm)/Red (excitation with 561 nm). Representative DIC and Peredox ratio images of Hke3 cells which report cytosolic NADH are shown before and after drugs addition. Scale bar = 20 µm. (B) Kinetics of all cells monitored are shown as means normalized to baseline ±SEM. (C) Analysis of the cytosolic NADH levels before each drug treatment (20, 40 and 60 min) and at the end of the experiment (80 min), additions are labelled with black arrows on top of the graph. (D) Cytosolic NADH baseline levels over the first 20 min, (E) quantification of the slope of cytosolic NADH (the change in Green/Red ratio over time in minutes), (F) the mean fold change in Green/Red ratio and (G) the mean duration for change in Green/Red ratio after each treatment are illustrated. Means ± SEM are shown from at least three independent experiments for each cell line (WT, n = 62; p53 KO, n = 62; Hke3 n = 66; Hke3 p53 KD, n = 37). *p ≤ 0.05 compared to WT control cells; #p ≤ 0.05 between cell lines (ANOVA, post-hoc Tukey).

