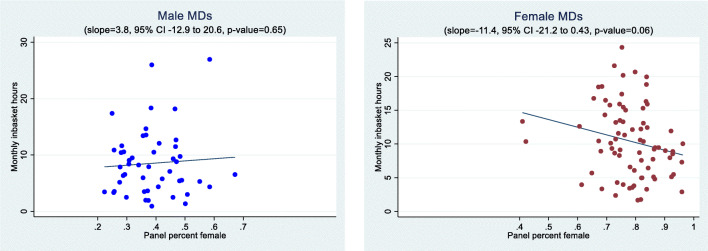
Figure 2.
Time spent in inbasket by physician gender and the percentage of female patients in the panel. Note: Figure shows one data point per physician where the monthly observations have been collapsed to the physician level by taking the mean of the monthly observations. The regression lines are estimated on the collapsed data. The comparable slopes and p-values for a regression of inbasket time on panel percent female using the individual monthly observations are 3.5 (95% CI −15.2 to 22.2, p-value=.72) for male MDs and −12.4 (95% CI −21.5 to −3.3, p-value =0.01) for female MDs.

