FIGURE 2.

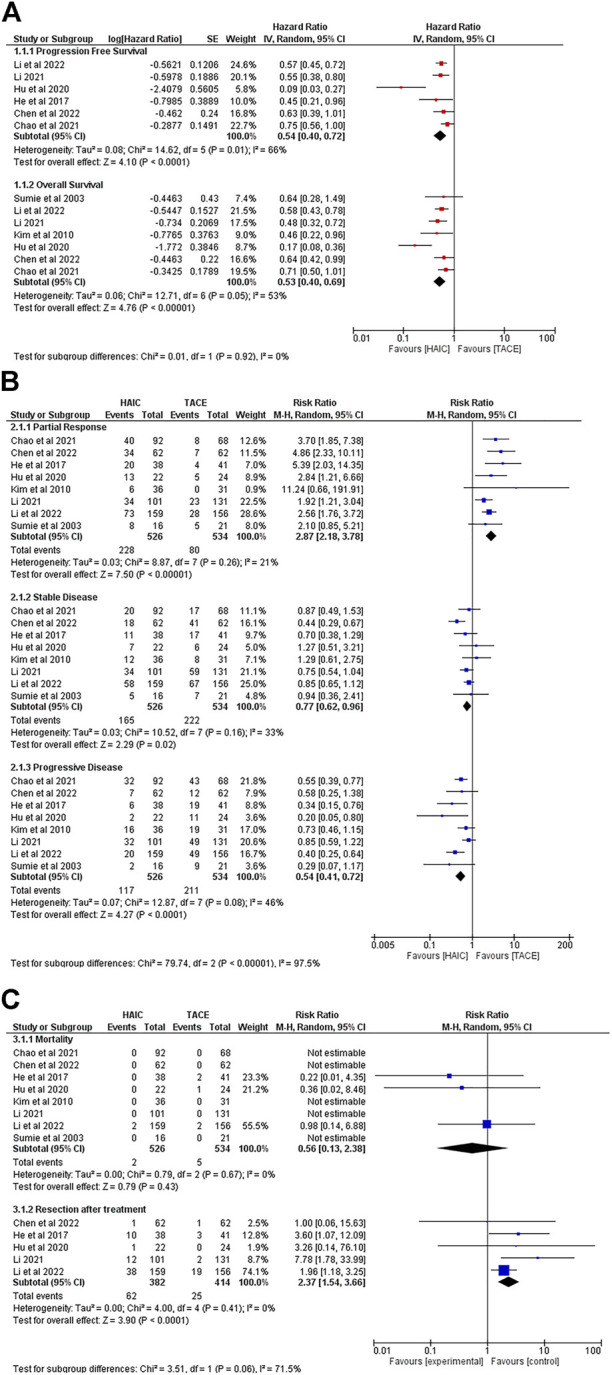
Comparisons of outcomes between the HAIC group and the TACE group. (A). Forest plots of survival; (B) Forest plots of tumour response after treatment; (C) Forest plots of mortality and the rate of resection after interventions.

Comparisons of outcomes between the HAIC group and the TACE group. (A). Forest plots of survival; (B) Forest plots of tumour response after treatment; (C) Forest plots of mortality and the rate of resection after interventions.