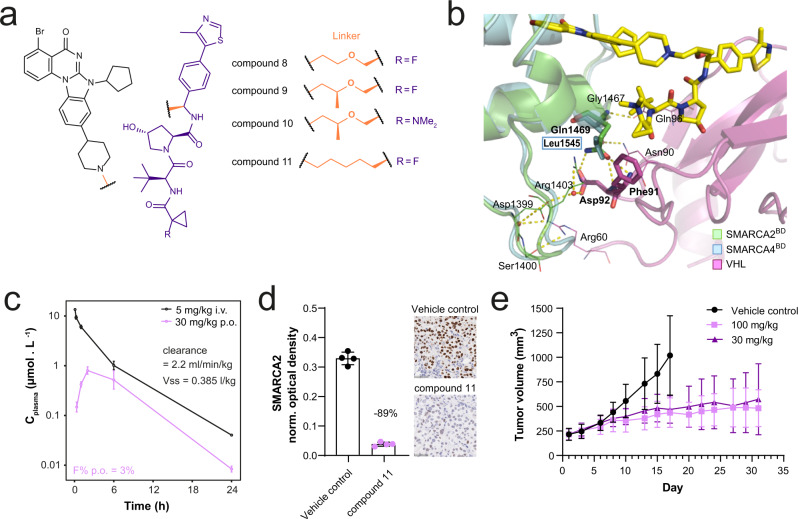
Fig. 3. Design and in vivo evaluation of an orally bioavailable VHL-based PROTAC.
a Structures of compound 8, compound 9, compound 10 and compound 11. SMARCA2 binding scaffold in black. VHL binding scaffold in purple. Exit vector and linker motifs connecting SMARCA2 and VHL binding scaffolds in orange. b Co-crystal structure of VCB: compound 10: SMARCA2BD in ribbon representation (PDB: 7Z76). VCB is shown in magenta, SMARCA2BD is shown in green with bound PROTAC shown in sticks with yellow carbons overlayed with SMARCA4BD in ribbon representation shown in blue. Represented are the key PPIs between VCB and SMARCA2BD/SMARCA4BD, highlighting the selectivity-inducing hydrogen bonding between Gln1469 of SMARCA2BD and VCB vs. Leu1545 in SMARCA4BD. c Plasma profiles of compound 11 in mouse after administration of 5 mg/kg i.v. (black) or 30 mg/kg p.o. (pink). Displayed are mean and standard deviation of n = 3 animals. d NCI-H1568 tumour bearing mice (average tumour size ~290 mm3) were treated orally with 100 mg/kg compound 11 (pink) or vehicle control (black; n = 4 animals per group) and tumours were collected 48 h after treatment. SMARCA2 levels were determined by IHC staining (representative images are shown, scale bar = 50 µm). Each datapoint represents the background-normalised OD within the viable tumour area of one tumour section, corresponding to one individual tumour. Mean OD levels and standard deviations are indicated. Percentages represent the median level of SMARCA2 signal decrease relative to vehicle control-treated samples. e NCI-H1568 tumour bearing mice (average tumour size ~220 mm3) were treated orally with compound 11 at 30 or 100 mg/kg daily (square vs. triangle in shades of pink). At day 17 after treatment start, TGI was 76% for the 100 mg/kg and 64% for the 30 mg/kg treatment group (adj. p value = 0.0009 for either regimen vs. control (black), one-tailed U-test with Bonferroni-Holm correction). Values represent the mean of 10 animals per group, error bars indicate standard deviation. Source data are provided as a Source Data file.

