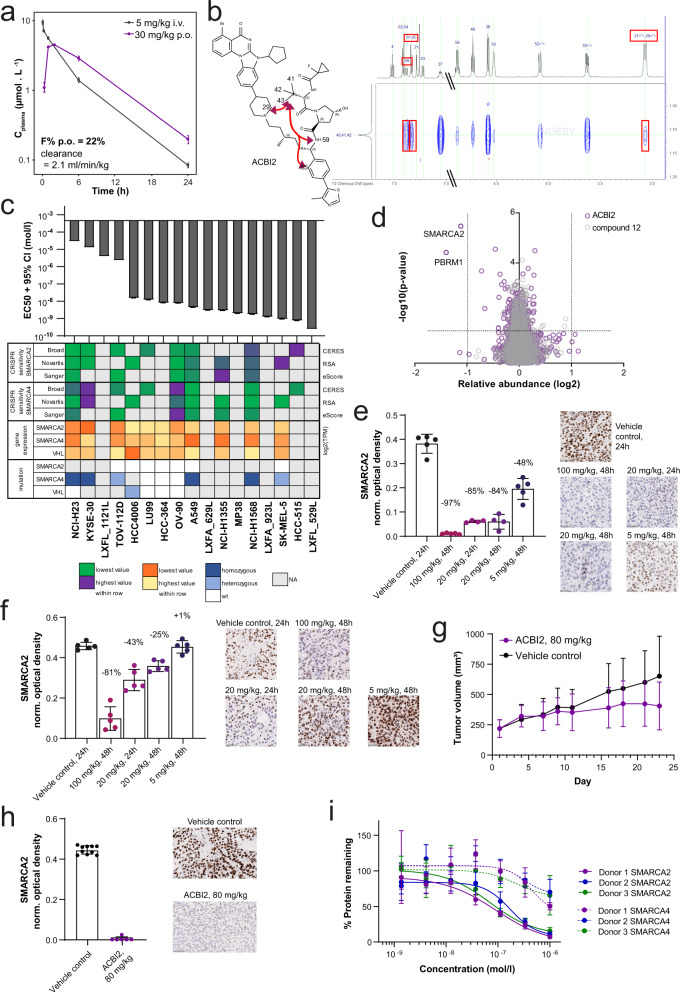
Fig. 4. ACBI2 is an orally bioavailable degrader that preferentially degrades SMARCA2 and induces lung cancer tumour growth inhibition.
a Plasma profiles of ACBI2 in mouse after administration of 5 mg/kg i.v. (black) or 30 mg/kg p.o. (purple). Displayed are mean and standard deviation of n = 3 animals. b Structure of ACBI2 (black) and selected long-range NOEs in 2D NOESY spectra (red). c The indicated cell lines were treated with ACBI2 for 144–192 h, and cell viability was measured using CellTiter Glo (n = 2 independent experiments for A549, HCC-364, HCC-515, HCC4006, KYSE-30, LU99, LXFA_629L, LXFA_923L, LXFL_529L, LXFL_1121L, MP38, NCI-H23, NCI-H1355, OV-90, SK-MEL-5, TOV-112D; n = 7 for NCI-H1568). Displayed are EC50 values with 95% confidence interval from 4-parametric logistic curve fit. Heatmap provides sensitivity to genetic depletion by CRISPR, gene expression and mutation data from DepMap/CCLE, colours are scaled for each row, i.e. across cell lines, but separate for each parameter according to legend. d Effects of ACBI2 (purple) and negative control compound 12 (grey, cis-hydroxyproline analogue of ACBI2 which is not capable of binding VHL) on the proteome of NCI-H1568 cells treated with the compounds at 100 nM for 4 h. Data are plotted as the log2 of the normalised fold change in abundance against −log10 of the p value per protein from n = 3 independent experiments (two-tailed t-tests assuming equal variances). e NCI-H1568 (average tumour size at treatment start ~470 mm3) or (f) A549 (average tumour size at treatment start ~360 mm3) tumour bearing mice were treated orally with 100 mg/kg, 20 mg/kg, 5 mg/kg ACBI2 or vehicle control (n = 5 animals per group; shades of purple) and tumours collected 24 or 48 h after treatment. Tumours from one animal (NCI-H1568 20 mg/kg ACBI2 24 and 48 h) could not be analysed due to necrosis. SMARCA2 levels were determined by IHC staining (representative images are shown, scale bar = 50 µm). Each datapoint represents the background-normalised OD within the viable tumour area of one tumour section, corresponding to an individual tumour. Mean OD levels and standard deviations are indicated. Percentages represent median levels of SMARCA2 signal decrease relative to vehicle (black). g A549 tumour bearing mice (average tumour size ~220 mm3) were treated orally with 80 mg/kg ACBI2 once daily (purple). At day 21 of treatment, a TGI of 47% (p value = 0.0351 vs. control (black), one-tailed U-test) was measured (mean and standard deviation of 10 animals per group). h At the end of the study in (g), tumours were collected and SMARCA2 levels determined as for (e, f); representative images are shown, scale bar = 50 µm. Mean OD levels and standard deviations are indicated in the graphs. The median level of SMARCA2 staining in ACBI2 treated tumours was reduced to background levels. i Human whole blood from three healthy donors (purple, blue, green) was treated with the indicated concentrations of ACBI2 for 18 h in the dark. Protein was extracted from PBMCs and relative SMARCA2 and SMARCA4 levels (each normalised to GAPDH, continuous vs. dashed line) measured using capillary electrophoresis (mean and standard deviation from three biological replicates, displayed relative to DMSO control). Source data are provided as a Source Data file.

