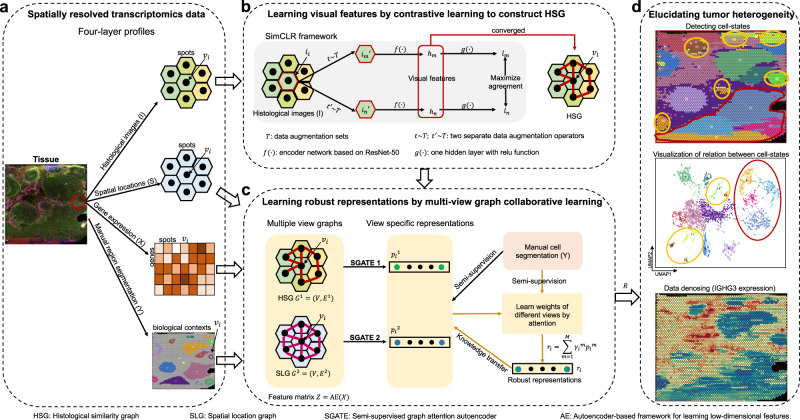
Fig. 1. Overview of stMVC model.
a Given each SRT data with four-layer profiles: histological images (), spatial locations (), gene expression (), and manual region segmentation () as the input, stMVC integrates them to disentangle tissue heterogeneity, particularly for the tumor. b stMVC adopts SimCLR model with feature extraction framework from ResNet-50 to efficiently learn visual features () for each spot () by maximizing agreement between differently augmented views of the same spot image () via a contrastive loss in the latent space (), and then constructs HSG by the learned visual features . c stMVC model adopting SGATE model learns view-specific representations ( and ) for each of two graphs including HSG and SLG, as well as the latent feature from gene expression data by the autoencoder-based framework as a feature matrix, where a SGATE for each view is trained under weak supervision of the region segmentation to capture its efficient low-dimensional manifold structure, and simultaneously integrates two-view graphs for robust representations () by learning weights of different views via attention mechanism. d Robust representations can be used for elucidating tumor heterogeneity: detecting spatial domains, visualizing the relationship distance between different domains, and further denoising data.

