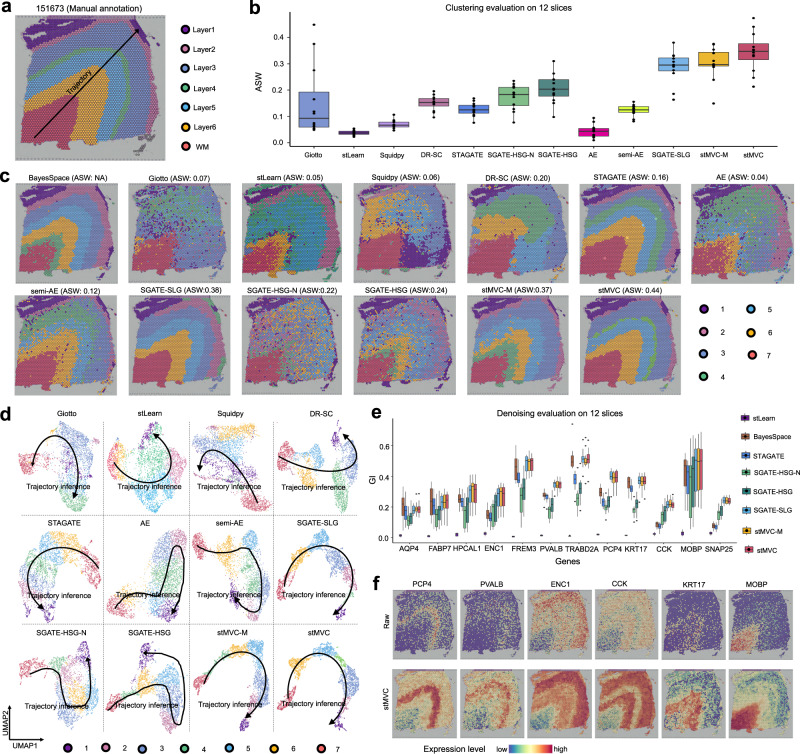
Fig. 2. stMVC is able to detect spatial domains, visualize the relationship distance between different domains, and denoise data on the DLPFC dataset.
a Annotation of seven DLPFC layers in slice 151673 by the previous study26, and the spatial adjacency and chronological order between these layers are WM → Layer6 → Layer5 → Layer4 → Layer3 → Layer2 → Layer1. b Boxplot of clustering accuracy in terms of average silhouette width (ASW) for assessing the closeness of multi-view joint features of same cluster compared to the other clusters, on all n = 12 samples. In the boxplot, the center line, box limits and whiskers separately indicate the median, upper and lower quartiles and 1.5 × interquartile range. c Spatial domains detected by BayesSpace, Giotto, stLearn, Squidpy, DR-SC, STAGATE, AE, semi-AE, the three SGATE-based single-view models, stMVC-M, and stMVC on slice 151673. d Scatter plot of the two-dimensional UMAP extracted from the latent features by Giotto, stLearn, Squidpy, DR-SC, STAGATE, AE, semi-AE, three SGATE-based single-view models, stMVC-M, and stMVC on slice 151673. Note that the trajectory between seven layers or domains is consistent with (a), and for each method, the predicted clusters and their colors are the same as (c). Note that subplot b–d BayesSpace cannot calculate ASW and visualized using UMAP. e Boxplot of the Gini-index (GI) score of gene expression data denoised by stLearn, BayesSpace, STAGATE, the three SGATE-based single-view models, stMVC-M, and stMVC for n = 12 samples. The higher GI score, the better the denoised data. In the boxplot, the center line, box limits and whiskers indicate the median, upper and lower quartiles and 1.5 × interquartile range, respectively. f Spatial expression of layer-specific genes:26 PCP4, PVALB, ENC1, CCK, KRT17, and MOBP for slice 151673 data denoised by stMVC, where we also provide raw data as a comparison. Source data are provided as a Source Data file.

