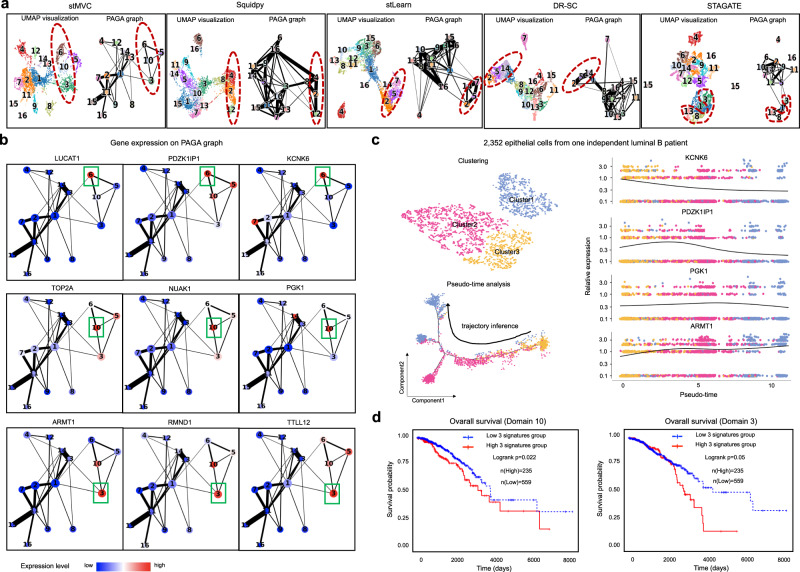
Fig. 4. stMVC is able to identify tumor-related cell-states and their transition cell-states from the invasive carcinoma region in the breast cancer sample.
a UMAP visualization and PAGA graph generated by the low-dimensional features by stMVC, Squidpy, stLearn, DR-SC, and STAGATE, respectively. The predicted clusters for each method are the same as in Fig. 3i. b Gene expression levels of nine marker genes for three different cell-states on the PAGA graph by the low-dimensional features of stMVC. c Visualization of the clustering and trajectory inference from 2352 epithelial cells of CID4067 (an independent luminal B patient), and pseudo-time-dependent changes in expression levels of KCNK6, PDZK1IP1, KGK1, and ARMT1. Each color indicates one cluster. d Total survival rate of patients with the high or low expression level of three representative signature genes of domain 10 (i.e., TOP2A, NUAK1, and PGK1, ) and domain 3 (i.e., ARMT1, RMND1, and TTLL12, ) in the RNA-seq data of breast cancer from TCGA database. The logrank test was used for the survival analysis. These breast cancer patients were classified into two groups based on their expression (high value, low value) for comparison of survival. Note that 794 samples with Luminal A, Luminal B, and Her2 subtypes by PAM50 were used in our survival analysis. Source data are provided as a Source Data file.

