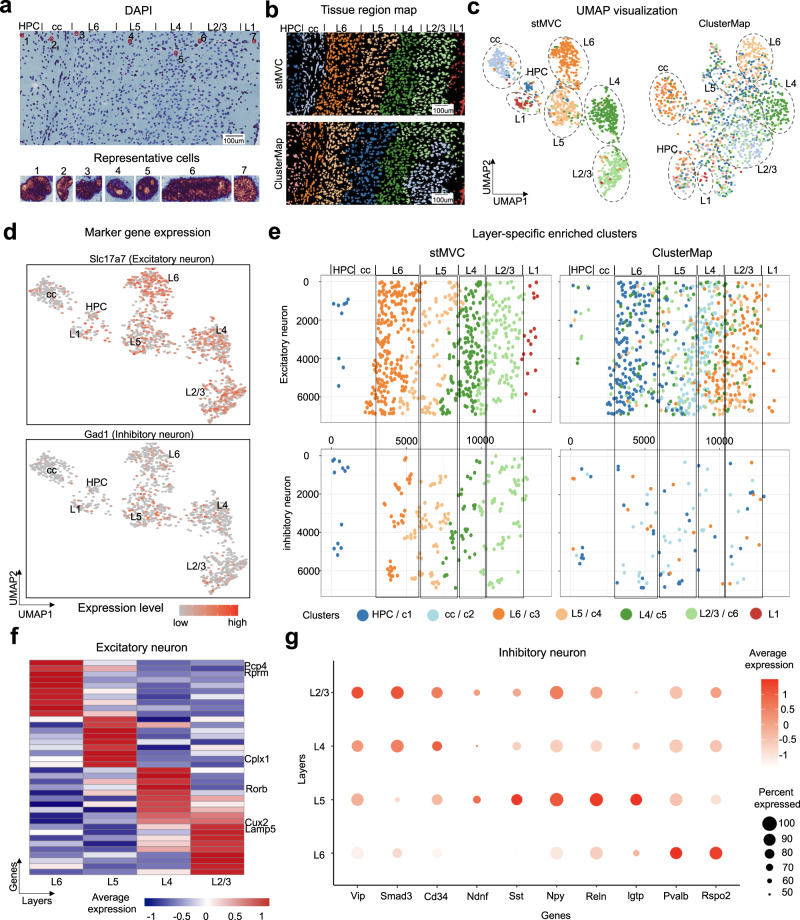
Fig. 5. stMVC enables the identification of layer-specific excitatory and inhibitory neurons in the mouse primary visual cortex (V1) dataset.
a Raw DAPI image of the V1 tissue annotated with seven functionally distinct layers (up panel). Seven representative cells from different layers (bottom panel). b Tissue region map predicted by stMVC and ClusterMap. c UMAP visualization of the latent features by stMVC and ClusterMap. The layer annotation and color for each cell are the same with (b). d UMAP visualization (by stMVC) of the marker genes Slc17a7 and Gad1 for excitatory and inhibitory neurons, respectively. e The spatial map of excitatory and inhibitory neurons predicted by stMVC and ClusterMap, respectively. Each color indicates one cluster. f Heatmap of the average gene expression of signature genes for four domains of excitatory neurons in L2-6 by stMVC. Rows and columns indicate genes and different layers, respectively. g Dot plot showing the expression levels of marker genes for different subtypes of inhibitory neurons in L2-6 by stMVC. Source data are provided as a Source Data file.

